Table of Contents
- Adjusted Turnover Margin Definition
- Adjusted Turnover Margin Examples and Statistics
- Can Adjusted Turnover Margin Help Me With Betting?
Adjusted Turnover Margin Definition
Adjusted turnover margin is a method of removing the idea of luck from a team's turnover margin, as much as possible. Turnover margin itself is simple. It's the ratio of turnovers conceded by a team to the number of turnovers that team generates in a given game or season.
As we all know, turnover margin is crucial to winning football games. In 2019, teams that had a positive edge in turnover margin were 151-41-6 against the spread.
Similarly jarring, a team's turnover margin accounts for approximately 42 percent of their win variance. It's arguably the most important statistic in football, and yet, there's a big impact of luck that goes into it? Let me explain.
While there is a level of skill that goes into conceding or generating turnovers, there is also a level of luck that each team has.
According to Bill Connelly, defenses recovered about 51.3% of offense's fumbles in 2011, so if a defense generated 50 fumbles in a season, they'd be expected to recover 25.15 of them. You could argue that tenacity and work rate also impacts the amount of fumbles a defense recovers, but a lot of it is going to be luck.
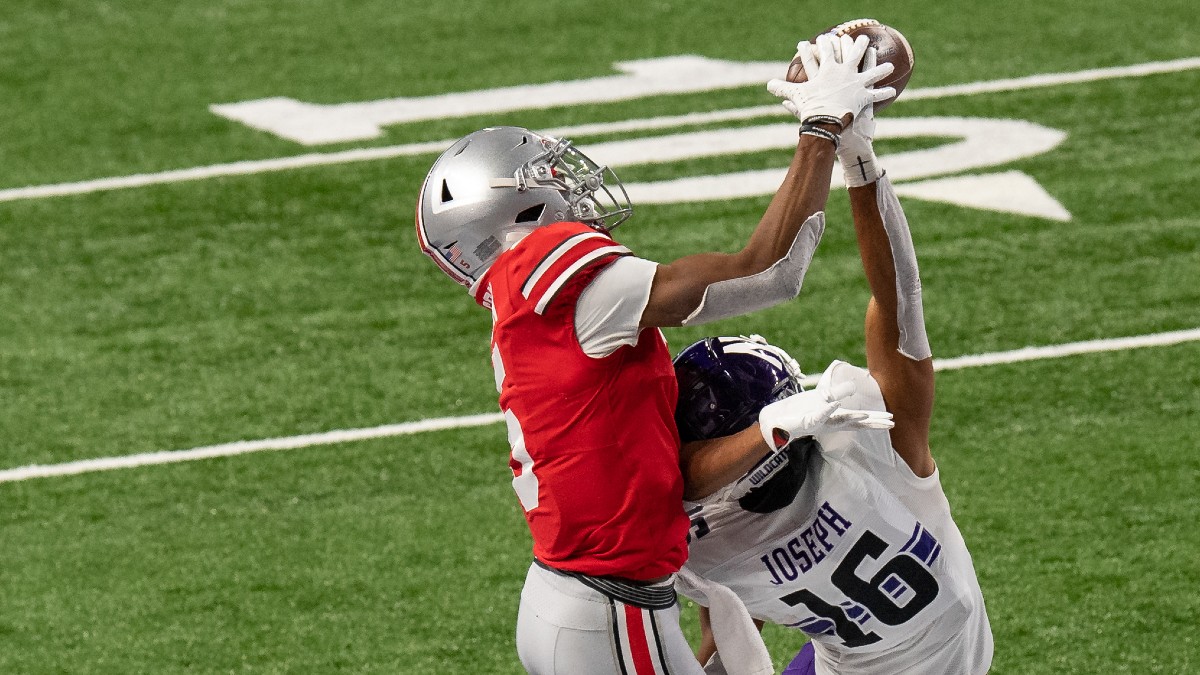
Similarly for interceptions, pass breakups versus interceptions are one metric that has a significant element of luck.
Adjusted Turnover Margin Examples and Statistics
While adjusted turnover margin statistics aren't easy to find online, I made an example chart for the Big Ten and how the metric could be evaluated in the context of the 2020 season. The assumptions that are being used are guided by Bill Connelly's 2012 evaluation and are listed below:
- Passes defended don't constitute a statistic of luck but rather the quality of a defense and its secondary.
- Interceptions have a skill element, but are also highly luck based, so I averaged the passes defended to interception ratio of the Big Ten and averaged it for all teams, then applied it to their passes defended volume. This isn't perfect, but it helps remove an element of luck.
- Fumbles forced are a skill-based stat, but fumbles recovered are not, and the average recovery rate of fumbles for defenses is 51.3 percent. I applied this percentage to all fumbles that teams had a chance to recover.
Based on the very imperfect numbers that I calculated, the most lucky teams with regards to turnover margin were Ohio State and Iowa, while the most unlucky teams were Penn State and Maryland. This "luckiness" likely had an impact on each team's season, as the former two finished first and second in their divisions respectively, while the latter two finished third and fourth.
Can Adjusted Turnover Margin Help Me With Betting?
This is going to be one of the hardest stats to implement into your arsenal for betting purposes, but if you take the time to create your own adjusted turnover margin as I did, it can be a massive boost to you.
Availability is limited with regards to adjusted turnover margin, and you'll likely have to create your own table. This is time-consuming, error-prone and difficult, but it can pay off. In the same piece I mentioned earlier, Bill Connelly quantified turnovers as worth 5 points, so these swings can have a significant impact on teams' perceptions, and thus their odds in many cases.


