Prop bets are historically way easier to beat than the larger sides and totals markets in the NFL. With lower limits and less money coming in, props tend to be less efficient than the major markets, so it’s easier for us to find an edge.
One of my favorite props to bet is "three straight scores by either team." It seemed to me that this bet would be heavily dependent on the spread, and possibly the total, since teams expected to win by (or score) more points would be more likely to score three straight times.
To find out for sure, I looked at every NFL drive since 2014. Then I charted how likely this prop was to hit compared to the spread and total.
NFL Prop Bet: 3 Straight Scores
Results
I put both spreads and totals into “buckets” to even out the number of games in each group. It wouldn’t make sense for the one game with a 62.5 total or 18.5 spread to count for as much as the 70+ games with a total of 47.5, for example. The groupings still weren’t totally even, meaning some buckets will exert more “pull” on the overall trend than others. Either way I’m confident enough in the results to bet on them myself.
Totals
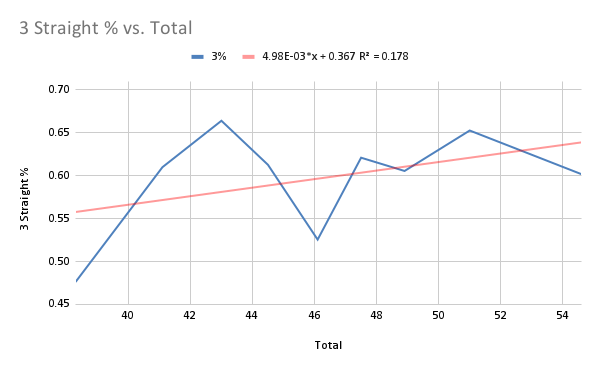
As you can see, the results obtained by comparing this prop just to the closing total is fairly noisy. The most important thing to note is the correlation coefficient “R2" above. This means that only 17.8% of the variance in result (whether either team scored three straight times) can be explained by the differences in the total. This might be enough for us to have an edge by itself. However, the fact that the line doesn’t trend strongly in either direction means I won’t be using it.
Spread
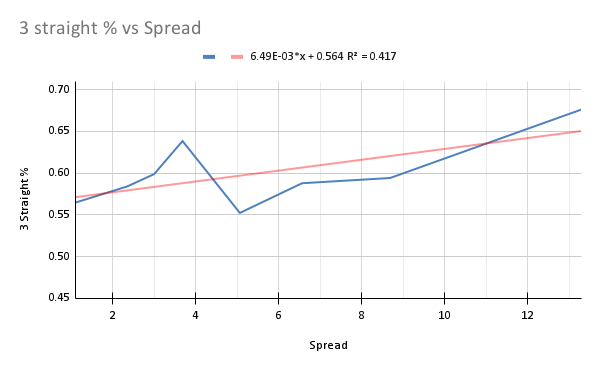
Now we’re talking. While there’s some bumps in the road, there’s a clear upward trend — as the spread increases, so do the number of games where either team scores three times consecutively. Our R2 is significantly stronger, over 40% of the variation in whether a game has three straight scores by a team is explained by changes in the spread. This is what I’m planning on betting in the future.
Additionally, the effect size (the upwards slope of the line) is higher when looking at the spread than when looking at the total (.56 and .36 respectively). This is important, a trend line that correlated perfectly but was precisely horizontal wouldn’t offer us any edge.
How Can I Use This?
If you were planning on betting just based on this information, you would need to convert the approximate percentages into a betting line using our odds calculator. Then, you’d need to decide on how much edge you’d require for a bet to be worth it. After that, you'd place your bet when the posted line is far enough away from what the “true” (based on my calculations) line should be. Here’s what that might look like when the spread is 3:

I calculated this using a 10% edge, so betting "Yes" is profitable if the odds are greater than -134. You’d bet "No" at +164 odds or longer. What will be key is what lines books hang in this situation. If they keep it between our ranges there won’t be any meat left on the bone, but that brings me to my next point.
Week 1 NFL Prop Bet
As of writing, BetMGM is the only major book where I can find this prop. Fortunately for us, they’ve given us a gift: Every single game has this bet as yes -250, no +175. The +175 converts to 36.36% implied odds.
Looking at my entire database, in games with a spread of three or less “no” hits at a rate of 41.21%, for an almost 5% edge. Spreads of 2.5 or less get you there 42.5% of the time (just over 6% edge.) There’s currently three such games on the board at MGM.
My personal favorite of these is the Chargers at Washington Football Team. This game currently has a one-point spread and a total of 44.5. From my research, games with a one-point spread and totals of 45 or less have hit the “no” side of this prop 44.44% of the time, good for over an 8% edge.
Let me know on Twitter if you see this bet elsewhere, I’d be happy to help price it for you.
Moving Forward
For some background, this type of bet is known as a derivative — a bet that is derived from some other betting line. Generally, odds-makers use formulas of their own that they use to calculate the odds for these bets. Their formula is likely more accurate than just using the spread. However, I don’t think they keep a close enough eye on the bet as the line moves.
Here’s what I mean. Say a Chiefs vs. Rams game opens with the Chiefs as a -3 favorite. This prop gets posted at yes -140, no +125, so there’s no edge to be found. Now, what happens if Matthew Stafford gets injured, and the line closes at Chiefs -12? My intuition is that books won’t move the prop, or move it but not enough, and now all of a sudden "yes" is a huge value at -140. This is what we can keep an eye on even without doing all of the math. If a line widens throughout the week, it’s likely that betting yes on this prop will be profitable. When the line tightens, betting no should have an edge.
Additionally, there’s probably some edge to be had betting "yes" close to kickoff. My gut feeling when I first started betting these last season was that betting "no" seemed like a good value most of the time; it’s usually fairly long odds. If the public feels the same way, betting "yes" would become a good value. This is presuming the books offering this prop move the lines as money comes in, which remains to be seen. If BetMGM or others keep the price stagnant, we have all the info we need. You can track the movement of NFL lines here.


