The Rams have become a consensus 4.5-point favorite after opening as low as -3, a change that has substantial historical implications.
How do 4-point or more favorites in the Super Bowl historically fare? Since the turn of the millennium: horribly, at least against the spread (ATS).
Since 2000, only two teams have covered as 4-point favorites or more. That's an ATS record of 2-10-1. Favorites of three or fewer points went 5-3 ATS in that span.
Super Bowl Favorites of 4 or More Points Since 2000
| Super Bowl | Odds | Result |
|---|---|---|
| 2018: Eagles 41, Patriots 33 | Patriots -4.5 | LOSS |
| 2016: Broncos 24, Panthers 10 | Panthers -4.5 | LOSS |
| 2013: Ravens 34, 49ers 31 | 49ers -4.5 | LOSS |
| 2010: Saints 31, Colts 17 | Colts -5 | LOSS |
| 2009: Steelers 27, Cardinals 23 | Steelers -7 | LOSS |
| 2008: Giants 17, Patriots 14 | Patriots -12 | LOSS |
| 2007: Colts 29, Bears 17 | Colts -7 | WIN |
| 2006: Steelers 21, Seahawks 10 | Steelers -4 | WIN |
| 2005: Patriots 24, Eagles 21 | Patriots -7 | LOSS |
| 2004: Patriots 32, Panthers 29 | Patriots -7 | LOSS |
| 2003: Bucs 48, Raiders 21 | Raiders -4 | LOSS |
| 2001: Patriots 20, Rams 17 | Rams -14 | LOSS |
| 2000: Rams 23, Titans 16 | Rams -7 | PUSH |
This wasn't always the case. The NFL, like every other major American professional sports league, has labored over the last 2 1/2 decades to ensure parity among its ranks.
No league has implemented measures as successful as the NFL, which force a hard salary cap and provide worse teams easier schedules the following season, among other measures.
These implementations from the mid-to-late 1990s onward drastically evened out the competitive playing field.
So it's no surprise that beforehand, Super Bowl favorites of four or more points were far more common — and won far more often.
From 1966 to 2000, Super Bowl favorites of 4+ points were 15-7-1 ATS. For reference, favorites of three or fewer points went 4-4.
And a favorite of four or more points occurred every year from 1989-2000. There have only been three Super Bowl favorites of four or more points since 2010.
Super Bowl Favorites of 4 or More Points From 1966-2000
| Super Bowl | Odds | Result |
|---|---|---|
| 1999: Broncos 34, Atlanta 19 | Broncos -7.5 | WIN |
| 1998: Broncos 31, Packers 24 | Packers -14 | LOSS |
| 1997: Packers 35, Patriots 21 | Packers -14 | PUSH |
| 1996: Cowboys 27, Steelers 17 | Cowboys -13.5 | LOSS |
| 1995: 49ers 49, Chargers 26 | 49ers -18.5 | WIN |
| 1994: Cowboys 30, Bills 13 | Cowboys -10.5 | WIN |
| 1993: Cowboys 52, Bills 17 | Cowboys -6.5 | WIN |
| 1992: Washington 37, Bills 24 | Washington -7 | WIN |
| 1991: Giants 20, Bills 19 | Bills -7 | LOSS |
| 1990: 49ers 55, Broncos 10 | 49ers -12 | WIN |
| 1989: 49ers 20, Bengals 16 | 49ers -7 | LOSS |
| 1987: Giants 39, Broncos 20 | Giants -9.5 | WIN |
| 1986: Bears 46, Patriots 10 | Bears -10 | WIN |
| 1980: Steelers 31, Rams 19 | Steelers -10.5 | WIN |
| 1978: Cowboys 27, Broncos 10 | Cowboys -6 | WIN |
| 1977: Raiders 34, Minnesota 14 | Raiders -4 | WIN |
| 1976: Steelers 21, Cowboys 17 | Steelers -7 | LOSS |
| 1974: Dolphins 24, Vikings 7 | Dolphins -6.5 | WIN |
| 1972: Cowboys 24, Dolphins 3 | Cowboys -6 | WIN |
| 1970: Chiefs 23, Vikings 7 | Vikings -12 | LOSS |
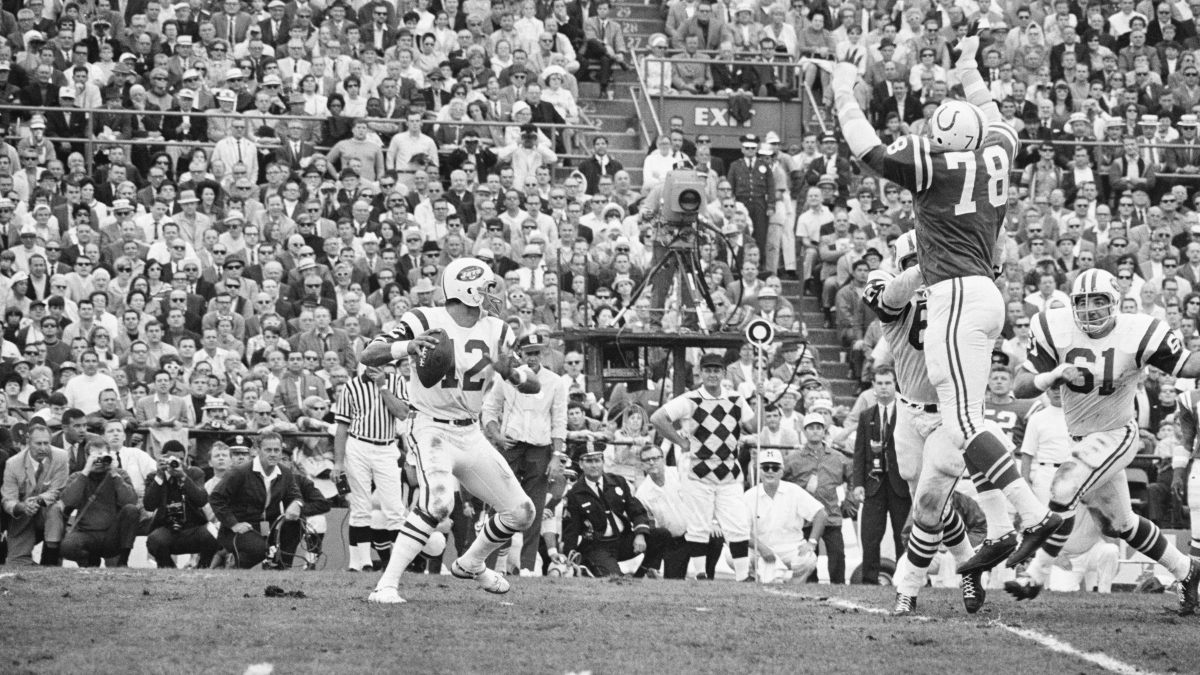
| 1969: Jets 16, Colts 7 | Colts -18 | LOSS |
| 1968: Packers 33, Raiders 14 | Packers -13.5 | WIN |
| 1967: Packers 35, Chiefs 10 | Packers -14 | WIN |


