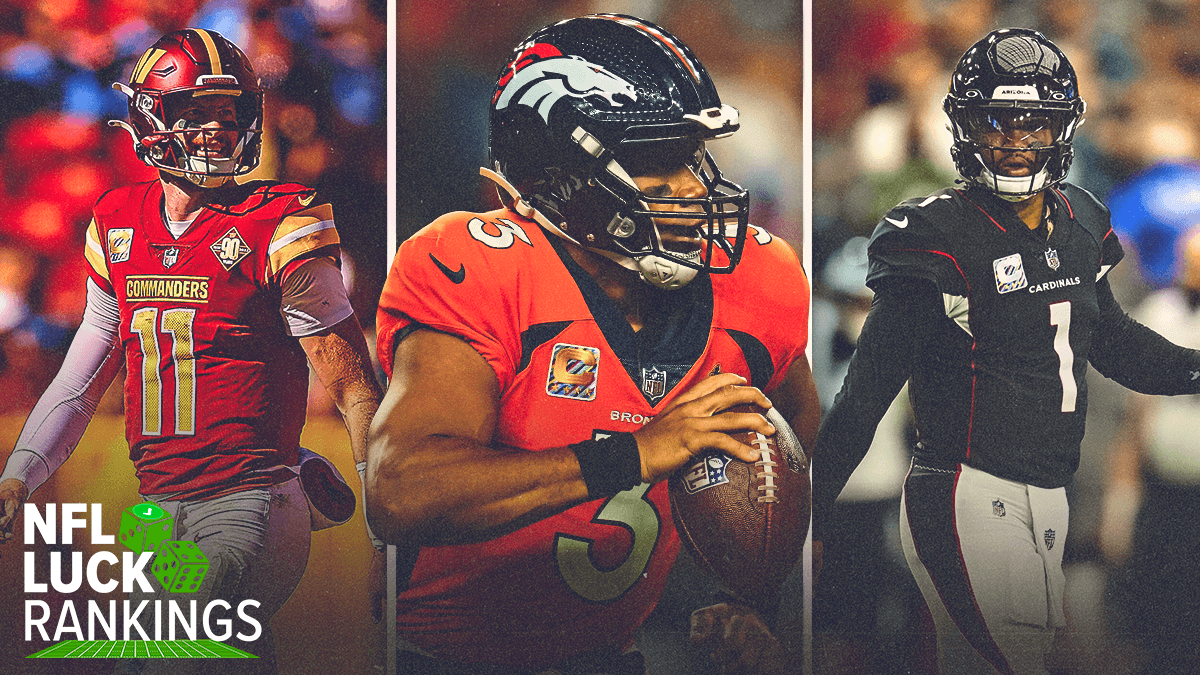
Last week the Action Network Predictive Analytics team unveiled our inaugural NFL Luck Rankings.
We designed these rankings to help you identify which teams’ results have been luckier — or unluckier — than their on-field performance indicates.
Last week, the unlucky team in our luck rankings went 11-5 against the spread (ATS) overall when looking at closing lines. That includes a 6-3 record ATS when there was a luck ranking difference of 10 or more places. When the luck difference is 16 or more, that improves to 4-1 in Week 5.
For more on how our luck rankings work, check out this piece which gives you a detailed example of the concept. Also, be sure to check out which three teams were the unluckiest in Week 5, because recency bias can play a factor in how the public perceives teams.
Let's dive into the Week 6 luck rankings!
Note: Luck% represents win probability swings indicating the difference between how a team's on-field performance differs from their win percentage.
NFL Luck Rankings
| RANK | TEAM | Luck % |
|---|---|---|
| 1 | 40.8% | |
| 2 | 31.0% | |
| 3 | 30.2% | |
| 4 | 28.4% | |
| 5 | 21.0% | |
| 6 | 17.6% | |
| 7 | 14.6% | |
| 8 | 11.8% | |
| 9 | 11.2% | |
| 10 | 9.6% | |
| 11 | 7.0% | |
| 12 | 5.8% | |
| 13 | 4.2% | |
| 14 | -1.6% | |
| 15 | -1.8% | |
| 16 | -2.2% | |
| 17 | -3.4% | |
| 18 | -4.8% | |
| 19 | -6.4% | |
| 20 | -6.8% | |
| 21 | -6.8% | |
| 22 | -7.2% | |
| 23 | -8.8% | |
| 24 | -10.0% | |
| 25 | -14.0% | |
| 26 | -17.0% | |
| 27 | -17.4% | |
| 28 | -22.2% | |
| 29 | -24.0% | |
| 30 | -25.4% | |
| 31 | -27.6% | |
| 32 | -32.6% |
Week 6 NFL Luck Matchups
Broncos (+5) vs. Chargers
Nick Giffen: This game has the biggest luck discrepancy in terms of raw ranking difference between two teams. The 18-place difference puts this game over the 15 mark, which is significant.
Unlucky teams that are at least 16 places more unlucky than their opponent are 13-2 ATS since Week 3 (when we started tracking results). Additionally, if we look at the W% Diff column, we can see the Chargers have been 31.2% more lucky than the Broncos.
This "Luck Gap" again is the biggest of the week. That's important because the unlucky team with a Luck Gap of 25% or more has gone 19-6 ATS. My colleague Brandon Anderson lists several other reasons why you should back the Broncos, which you can check out here.
Cardinals (-2.5) vs. Seahawks
Sean Koerner: The Cardinals come into this game 13 places lower in the luck rankings than the Seahawks, including a 21.3% Luck Gap last week when they lost by only three points to the undefeated Eagles. That came in part because of a missed field goal by their backup kicker with 22 seconds left in the game.
On the flip side, the Seahawks are still quite lucky thanks to their 17-16 win over the Broncos. Denver lost not one, but two fumbles at the goal line in that game.
Commanders (PK) vs. Bears
Nick Giffen: Tonight's game between the Commanders and Bears features two teams that have struggled so far.
However, the Commanders have been much more unlucky in their struggles.
This 13-place luck ranking difference with a 18.4% Luck Gap is certainly notable but not quite on the scale of the top two picks.
With 62% of the money on the Bears, this could be a spot to fade the public.
Bonus: Ravens (-5.5) vs. Giants
Nick Giffen: Avid followers of the Luck Rankings may question why I have a game on here where the unlucky team is only five places below the lucky team.
The reason is because of the Luck Gap. The Giants have been so incredibly lucky this year in terms of win/loss percentage that even this five-place difference is quite significant.
The Giants have a winning percentage 40.8% higher than expected. So while the Ravens have been lucky, that winning percentage difference is only 17.6% on their end.
Subtracting those two numbers, we see the Ravens-Giants have a Luck Gap of 23.2%, good enough to be on the Ravens as a significantly unlucky team here.
- W: The number of games a team has won (note: ties count as half a win)
- Exp W: A team’s expected wins from their on-field performance
- W Diff: The difference between a team's actual wins and their expected wins.
- W%: A team's actual winning percentage
- Exp W%: A team’s expected winning percentage from their on-field performance
- W% Diff: The difference between a teams actual winning percentage and their expected winning percentage


