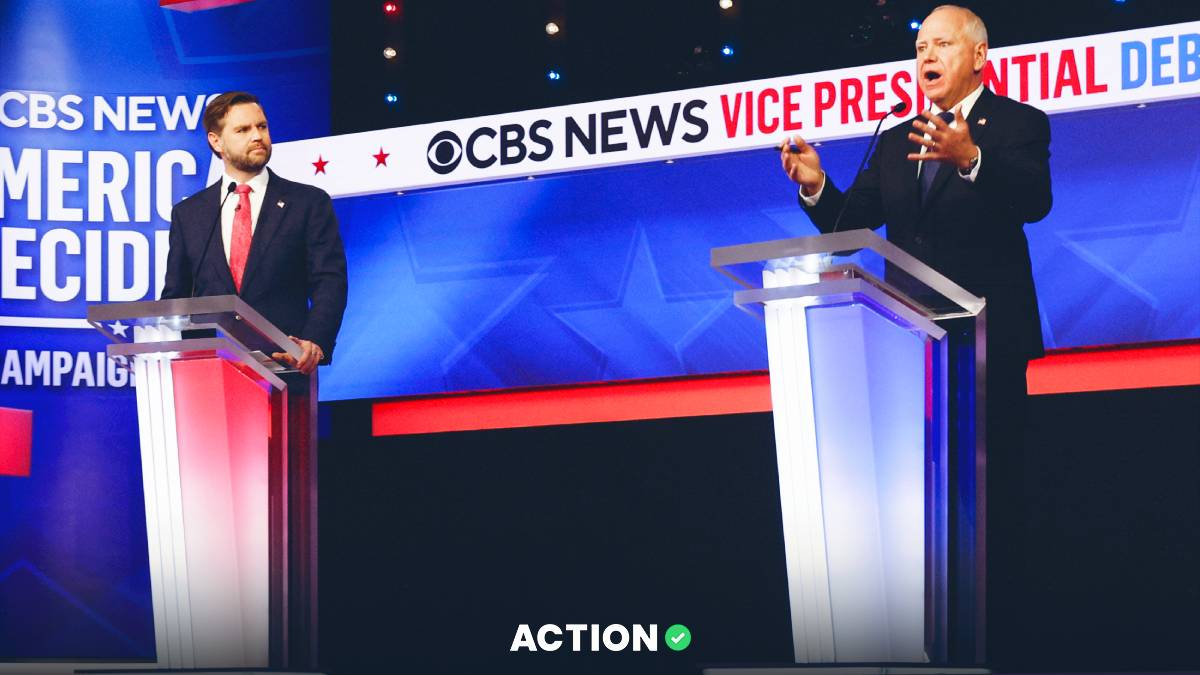
The first vice-presidential debate between JD Vance and Tim Walz was a lively affair, complete with cut mics and a healthy back-and-forth. But how much of an impact did it really have on the 2024 United States presidential election?
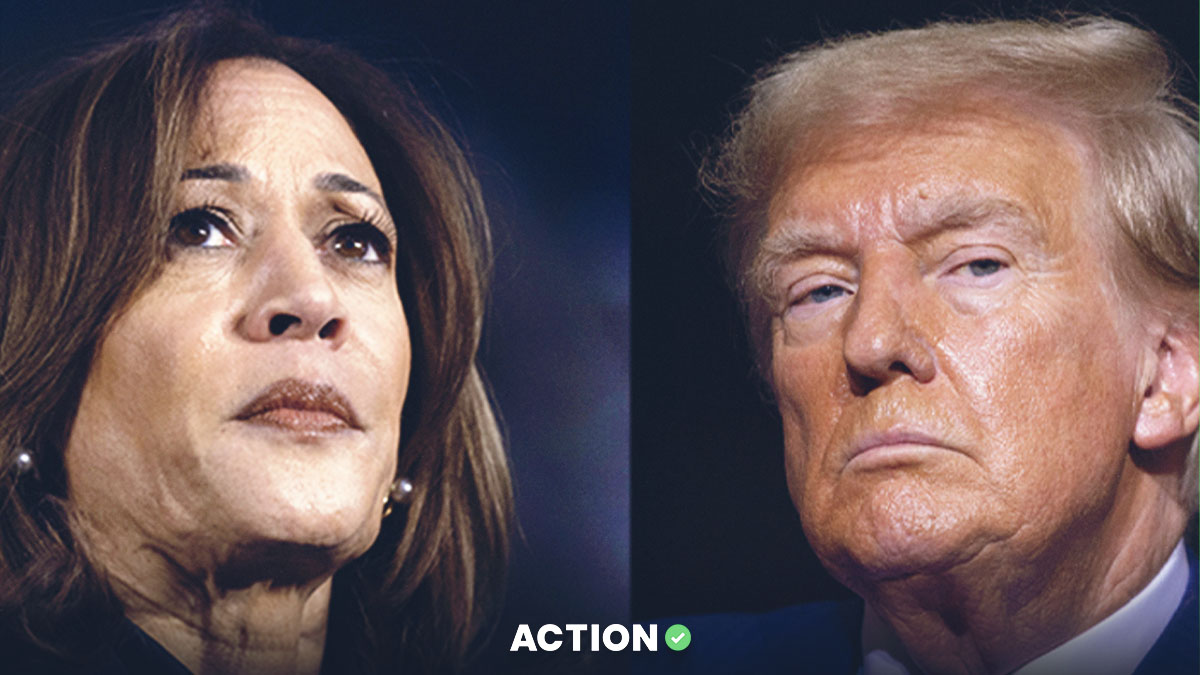
Based on the presidential election odds, not much, if any — which is probably to be expected. While both Vance and Walz are important parts of their tickets, this election is really about Kamala Harris vs. Donald Trump.
So, how did the election betting odds move on Tuesday night during and immediately after the Vance-Walz debate? Let's take a look.
United States Presidential Election Odds
| Presidential Candidate | Election Odds | Chance to Win Election |
|---|---|---|
| Kamala Harris | -122 | 51.20% |
| Donald Trump | -110 | 48.80% |
Odds are according to BetMGM UK. The "chance to win the election" percentages are based on implied probabilities with the vigorish removed. Gambling on elections is currently not legally allowed at sportsbooks in the United States.
If you've been following along with our recent election coverage, those numbers might look familiar. In reality, the odds as to who will win the November election did not move during or after Tuesday night's debate between JD Vance and Tim Walz. Whether the topic was Iran's attack on Israel, climate change, economic policy, gun control, the housing market, or any of a number of other important subjects, the lines stayed the same.
Kamala Harris Odds, Chance to Win Election
Vice President Kamala Harris was a -122 favorite to win the presidential election (a 51.20% chance) before Tuesday's VP debate started, and she's still a -122 favorite over Donald Trump after the Walz-Vance debate.
Donald Trump Odds, Chance to Win Election
Former President Donald Trump remains a -110 underdog to win the election, giving Trump a 48.80% chance of reclaiming the White House.
Again, this makes sense. As engaging as both Vance and Walz were, they're more or less proxies for their respective running mates. Short of one of them going completely off-script or having a disastrous, Joe Biden-esque debate performance (sorry, Joe, but we all know it's how we got here), the odds weren't going to move much — or, apparently, at all.
Just for fun, compare that to the first Trump vs. Harris debate, which saw a drastic change in the election odds. Before that September debate, Trump was the betting favorite to win the 2024 election at -133 odds, with Harris a +110 underdog. After that debate, Harris moved to a -110 favorite, with Trump +110. Harris has been the favorite since, ranging from -137 to the current -122.
Presidential Election Predictions
| Party | Odds | Chance to Win |
|---|---|---|
| Democrats | -122 | 50.73% |
| Republicans | -110 | 48.35% |
| Independent/Any Other Party | +10000 | 0.91% |
The odds on which party will win the November 5 presidential election are essentially the same as the Harris vs. Trump odds, with the Democrats -122 favorites like Harris and the Republicans -110 underdogs like Trump. The only wrinkle is the inclusion of odds of an Independent or third-party candidate winning the election at 100-1, or a less than 1% chance (and even that is obviously way higher than the actual chance of such an outcome).
Because this is a three-way market, the Democrats have a 50.73% chance to retain the White House, compared to Harris' 51.20% chance, while the Republicans have a 48.35% chance of victory compared to Trump's 48.80% chance.
Of note, BetMGM currently doesn't have posted markets on how many electoral votes each candidate will win, as they have recently. However, the most likely outcome based on the electoral voting odds earlier in the day was a Harris victory over Trump, with the Democratic nominee winning between 270 and 299 electoral votes. Given that the presidential election odds didn't move during or after the vice-presidential debate, a Harris victory is still the odds-based prediction for the winner of the election five weeks from now.
Earlier in the day Tuesday, the latest national polling average had Harris ahead by 2.7%, not far off from the 2.4% edge projected by the current election odds of Harris -122 / Trump -110.
Election Odds for Every State
| State | Trump's Odds to Win | Harris' Odds to Win |
|---|---|---|
| Alabama | -10000 | +3300 |
| Alaska | -10000 | +1200 |
| Arizona | -225 | +150 |
| Arkansas | -10000 | +3000 |
| California | +3000 | -10000 |
| Colorado | +1200 | -4000 |
| Connecticut | +2000 | -10000 |
| Delaware | +2500 | -10000 |
| Florida | -1000 | +500 |
| Georgia | -182 | +130 |
| Hawaii | +2500 | -10000 |
| Idaho | -10000 | +2500 |
| Illinois | +2500 | -10000 |
| Indiana | -10000 | +2500 |
| Iowa | -4000 | +1000 |
| Kansas | -10000 | +2500 |
| Kentucky | -10000 | +3000 |
| Louisiana | -10000 | +2500 |
| Maine | +650 | -1800 |
| Maryland | +3300 | -10000 |
| Massachusetts | +3000 | -10000 |
| Michigan | +150 | -225 |
| Minnesota | +1200 | -5000 |
| Mississippi | -10000 | +5000 |
| Missouri | -10000 | +2500 |
| Montana | -10000 | +1400 |
| Nebraska | -10000 | +2000 |
| Nevada | -111 | -125 |
| New Hampshire | +800 | -4000 |
| New Jersey | +1400 | -5000 |
| New Mexico | +1200 | -5000 |
| New York | +2500 | -10000 |
| North Carolina | -167 | +120 |
| North Dakota | -10000 | +3300 |
| Ohio | -5000 | +1200 |
| Oklahoma | -10000 | +3000 |
| Oregon | +1600 | -10000 |
| Pennsylvania | -111 | -125 |
| Rhode Island | +2500 | -10000 |
| South Carolina | -10000 | +2500 |
| South Dakota | -10000 | +5000 |
| Tennessee | -10000 | +5000 |
| Texas* | N/A | N/A |
| Utah | -10000 | +2500 |
| Vermont | +5000 | -10000 |
| Virginia | +650 | -1800 |
| Washington | +2000 | -10000 |
| West Virginia | -10000 | +3300 |
| Wisconsin | +130 | -182 |
| Wyoming | -10000 | +5000 |
*BetMGM does not have listed odds for Texas. This does not appear to be because the Lone Star State is all but decided, since states that are polling even more heavily for Trump are on the board. We have reached out to MGM to see if they have any comment.
As we noted on Tuesday, 18 states have seen their presidential election odds shift over the past two weeks. The Democrats have extended big leads in Delaware, Hawaii, Illinois, New Mexico and Rhode Island, while the Republicans have increased their decisive advantages in Indiana, Kansas, Louisiana, Missouri, Montana, South Carolina and Utah.
In more competitive states, it's mostly been good news for the Republicans. In Arizona, for example, the GOP increased its lead slightly from -200 to -225. In Georgia, the Republicans moved from -154 to -182. The Republicans also took a much larger lead in Ohio, going from -2000 to -5000, and made some slight progress in their uphill battle in Minnesota, moving from +1400 to +1200.
The Democrats, on the other hand, saw their odds in Florida get slightly worse (+450 to +500), but did extend their lead in Michigan from -182 to -225.
Here's how the state-by-state odds translate into percentage chances for each candidate to win each state.
Chance to Win Each State
| State | Trump's Chance to Win | Harris' Chance to Win |
|---|---|---|
| Alabama | 97.12% | 2.88% |
| Alaska | 92.79% | 7.21% |
| Arizona | 63.38% | 36.62% |
| Arkansas | 96.84% | 3.16% |
| California | 3.16% | 96.84% |
| Colorado | 7.31% | 92.69% |
| Connecticut | 4.59% | 95.41% |
| Delaware | 3.74% | 96.26% |
| Florida | 84.51% | 15.49% |
| Georgia | 59.75% | 40.25% |
| Hawaii | 3.74% | 96.26% |
| Idaho | 96.26% | 3.74% |
| Illinois | 3.74% | 96.26% |
| Indiana | 96.26% | 3.74% |
| Iowa | 91.48% | 8.52% |
| Kansas | 96.26% | 3.74% |
| Kentucky | 96.84% | 3.16% |
| Louisiana | 96.26% | 3.74% |
| Maine | 12.34% | 87.66% |
| Maryland | 2.88% | 97.12% |
| Massachusetts | 3.16% | 96.84% |
| Michigan | 36.62% | 63.38% |
| Minnesota | 7.28% | 92.72% |
| Mississippi | 98.06% | 1.94% |
| Missouri | 96.26% | 3.74% |
| Montana | 93.69% | 6.31% |
| Nebraska | 95.41% | 4.59% |
| Nevada | 48.64% | 51.36% |
| New Hampshire | 10.22% | 89.78% |
| New Jersey | 6.37% | 93.63% |
| New Mexico | 7.28% | 92.72% |
| New York | 3.74% | 96.26% |
| North Carolina | 57.91% | 42.09% |
| North Dakota | 97.12% | 2.88% |
| Ohio | 92.72% | 7.28% |
| Oklahoma | 96.84% | 3.16% |
| Oregon | 5.61% | 94.39% |
| Pennsylvania | 48.64% | 51.36% |
| Rhode Island | 3.74% | 96.26% |
| South Carolina | 96.26% | 3.74% |
| South Dakota | 98.06% | 1.94% |
| Tennessee | 98.06% | 1.94% |
| Texas* | N/A | N/A |
| Utah | 96.26% | 3.74% |
| Vermont | 1.94% | 98.06% |
| Virginia | 12.34% | 87.66% |
| Washington | 4.59% | 95.41% |
| West Virginia | 97.12% | 2.88% |
| Wisconsin | 40.25% | 59.75% |
| Wyoming | 98.06% | 1.94% |
Remember that the United States presidential election is decided by which candidate wins the 270 electoral votes necessary to win the Electoral College, not who wins the national popular vote. (As an aside, the Democrats are currently -600 favorites to win the popular vote, with the Republicans +325). Electoral votes are allocated on a state-by-state basis, based on the number of members of the House of Representatives, plus the two members of the Senate in each state, with Washington, D.C. also having three electors, for a total of 538 electoral college votes.
That means that 270 electoral votes is the minimum number needed to win the majority of the votes. And with 34 days until the election, things are only going to heat up from here.


