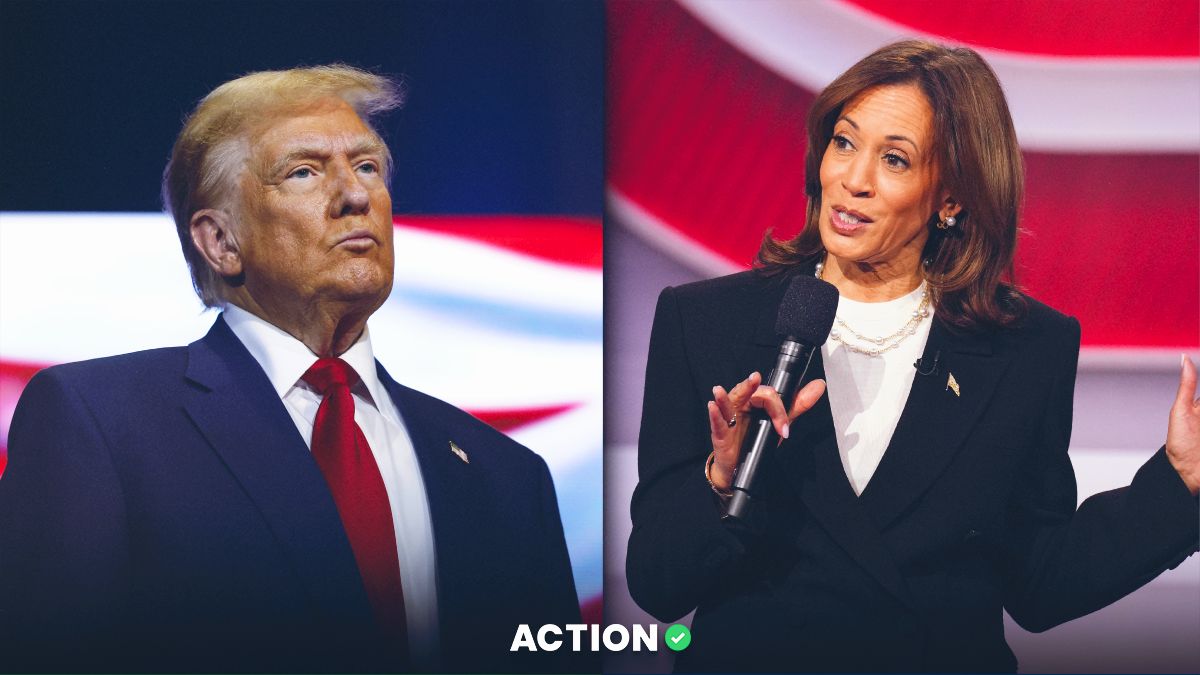
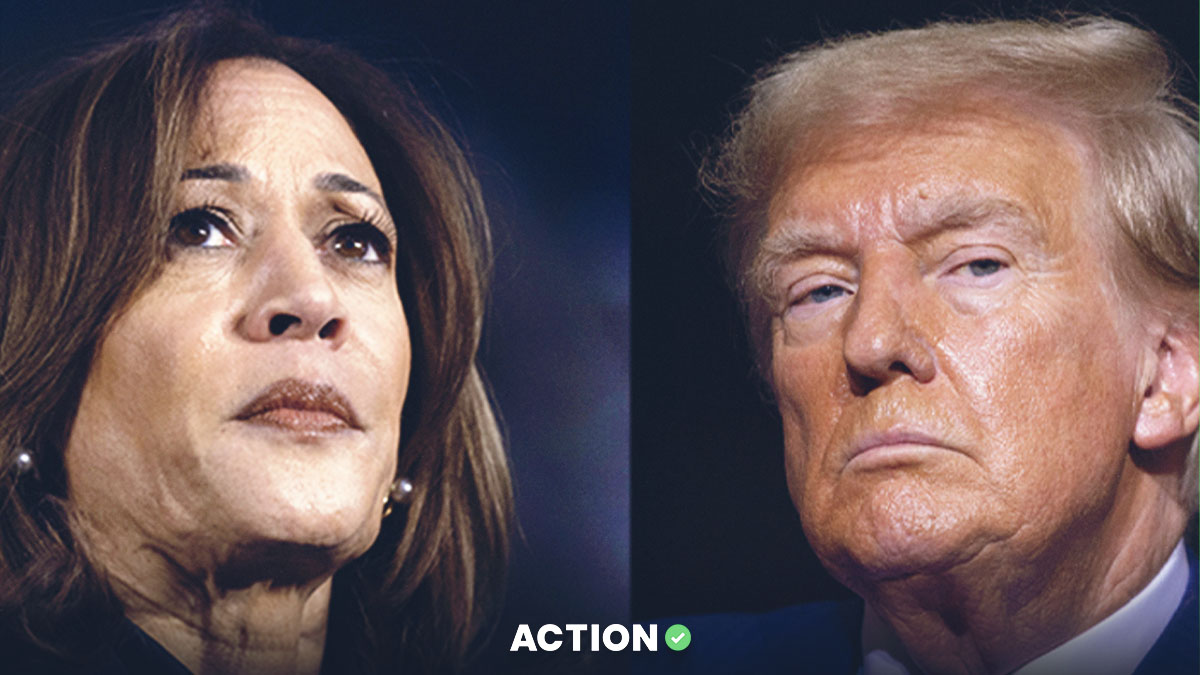
Wondering who has the upper hand in the 2024 presidential election? This article covers the latest presidential election odds and the key factors influencing them. We’ll explore how former President Donald Trump and Vice President Kamala Harris are faring in the betting markets and what this means for predicting the upcoming election.
Presidential Election Predictions: Key Takeaways
- Donald Trump currently holds a significant lead in betting odds for the 2024 presidential election, with a 62.18% chance of winning compared to Kamala Harris’s 37.82%. His odds improved slightly on Monday from -182 to -192. Kamala Harris is +150.
- Initially favored shortly after entering the race, Harris’s odds have declined sharply in recent weeks as Trump’s campaign gained momentum, highlighting the impact of public sentiment and momentum.
- Swing states are increasingly moving in the former president's direction, with Trump currently favored in several key battlegrounds despite national polls showing a close race.
Election Odds for Harris vs. Trump
| Presidential Candidate | Election Odds | Chance to Win |
|---|---|---|
| Donald Trump | -192 | 62.18% |
| Kamala Harris | +150 | 37.82% |
Odds are according to BetMGM UK. The "chance to win the election" percentages are based on implied probabilities with the vigorish removed. Gambling on elections isn't currently legally allowed at sportsbooks in the United States.
As the 2024 presidential election approaches, the betting markets provide a fascinating snapshot of public sentiment. Currently, Donald Trump has a significant lead in betting odds, with a 62.18% chance of winning based on his -192 odds, compared to Kamala Harris’s 37.82% chance of victory given her odds of +150.
Trump was -182 on Sunday, with Harris +150. At the time, those odds gave Trump a 61.74% chance of victory and Harris a 38.26% chance.
It wasn’t always this way. When Harris first entered the race, she led the odds within two and a half weeks of replacing President Joe Biden as the Democratic nominee, buoyed by his endorsement. She was even a -122 favorite as recently as the vice-presidential debate between JD Vance and Tim Walz.
However, as Trump turned up the heat with his campaign strategies and capitalized on his base’s unwavering support, the odds have shifted dramatically, with his betting lead as high as 63% in some markets, even more than what you might see in polls. He reclaimed the lead three weeks ago despite a Times/Siena poll showing strong numbers for Harris, and his lead has only gotten bigger since recently surpassing 60%.
The 2024 presidential election is set to take place on November 5, a date that will also see elections for the U.S. Senate, House of Representatives, and various state offices.
Electoral Votes Projections
How Many Electoral Votes Will Donald Trump Win?
| Trump Electoral Votes Won | Odds | Percentage Chance |
|---|---|---|
| 179 or Fewer | +2500 | 2.94% |
| 180-209 | +1200 | 5.88% |
| 210-239 | +500 | 12.74% |
| 240-269 | +325 | 17.99% |
| 270-299 | +250 | 21.84% |
| 300-329 | +200 | 25.48% |
| 330-359 | +650 | 10.19% |
| 360+ | +2500 | 2.94% |
How Many Electoral Votes Will Kamala Harris Win?
| Harris Electoral Votes Won | Odds | Percentage Chance |
|---|---|---|
| 179 or Fewer | +2500 | 3.03% |
| 180-209 | +1200 | 6.06% |
| 210-239 | +225 | 24.23% |
| 240-269 | +250 | 22.50% |
| 270-299 | +300 | 19.69% |
| 300-329 | +450 | 14.32% |
| 330-359 | +1000 | 7.16% |
| 360+ | +2500 | 3.03% |
Comparing Polls and Betting Odds
Trump's -192 odds represent the best chances the former president has had since Joe Biden dropped out of the election. Conversely, Harris’s +150 odds are the worst she has experienced since Biden’s withdrawal. This dynamic underscores the importance of staying updated with the latest odds, providing a real-time pulse of the electoral race.
While betting odds offer one lens, traditional polling data provides a different perspective, as national polls show a much closer race despite the betting markets heavily favoring Trump. This discrepancy can be attributed to the tight polling data from key battleground states, which heavily influence shifts in betting odds.
Polling data from these battleground states often determines the election’s overall outcome. For instance, polling companies like 538 collect data from various sources and apply quality control criteria to generate polling averages. However, these polls face challenges in accurately reflecting voter populations and predicting turnout, which can lead to underestimating support for candidates like Trump, as seen in both 2016 and 2020.
A notable example is Kamala Harris’s nearly four percentage point lead over Trump at the end of August. Despite this, the betting odds still favored Trump, highlighting the complex interplay between polling data and betting markets. Grasping this relationship is key to making informed predictions about the election outcome.
Key Factors Influencing Election Odds

Several factors influence the betting odds for the 2024 presidential election. The performance and approval ratings of the incumbent president play a significant role, especially in the months leading up to the election. Kamala Harris’s odds briefly increased due to a solid performance in a nationally televised CNN town hall earlier this week before Trump's lead bounced back.
Economic issues, a primary concern for voters, directly impact their betting preferences. Trump’s perceived advantage in economic matters has contributed to his increasing betting odds. Voters tend to evaluate economic conditions over a longer period, not just the current election year, making this a critical factor in shaping their decisions.
But it’s not just about the economy. Issues such as crime and healthcare also shape voter sentiment during elections. Upcoming debates and potential legal issues for the candidates could further influence the odds as election day approaches. The betting-based forecasting model integrates national and state-level polls, economic data, historical voting trends, and demographics to estimate potential outcomes more accurately.
Swing States and Their Impact on Odds
Swing states are the critical battlegrounds that can tip the scales in a presidential election. For 2024, the election swing states include Arizona, Georgia, Michigan, Nevada, North Carolina, Pennsylvania, and Wisconsin. These states are unpredictable in their voting patterns, making them crucial targets for both candidates.
Trump is currently favored in several swing states, including Pennsylvania, Arizona, Georgia, North Carolina, with leads varying from narrow margins to several percentage points. This advantage is also reflected in the betting trends, with Trump claiming recent leads in Wisconsin and Nevada as well. Despite national polls showing a close race, Trump’s support in these battleground states appears stronger. However, while Trump had been recently leading in the odds to win Michigan, the odds in that state are now 50/50.
Voter sentiment in swing states is highly dynamic, influenced by current events, debates, and recent developments. As the election date approaches, these states will play a pivotal role in determining the overall outcome, becoming focal points for both campaigns.
| State | Odds for Trump | Odds for Harris |
|---|---|---|
| Alabama | -10000 | +3300 |
| Alaska | -10000 | +1200 |
| Arizona | -455 | +275 |
| Arkansas | -10000 | +3000 |
| California | +3000 | -10000 |
| Colorado | +1400 | -10000 |
| Connecticut | +2000 | -10000 |
| Delaware | +2500 | -10000 |
| Florida | -2500 | +900 |
| Georgia | -286 | +180 |
| Hawaii | +2500 | -10000 |
| Idaho | -10000 | +2500 |
| Illinois | +2500 | -10000 |
| Indiana | -10000 | +2500 |
| Iowa | -10000 | +1400 |
| Kansas | -10000 | +2500 |
| Kentucky | -10000 | +3000 |
| Louisiana | -10000 | +2500 |
| Maine | +800 | -4000 |
| Maryland | +3300 | -10000 |
| Massachusetts | +3000 | -10000 |
| Michigan | -118 | -118 |
| Minnesota | +700 | -2500 |
| Mississippi | -10000 | +5000 |
| Missouri | -10000 | +2500 |
| Montana | -10000 | +1400 |
| Nebraska | -10000 | +2000 |
| Nevada | -182 | +130 |
| New Hampshire | +500 | -1200 |
| New Jersey | +1400 | -5000 |
| New Mexico | +1200 | -5000 |
| New York | +2500 | -10000 |
| North Carolina | -286 | +180 |
| North Dakota | -10000 | +3300 |
| Ohio | -10000 | +1400 |
| Oklahoma | -10000 | +3300 |
| Oregon | +1600 | -10000 |
| Pennsylvania | -137 | +100 |
| Rhode Island | +2500 | -10000 |
| South Carolina | -10000 | +2500 |
| South Dakota | -10000 | +5000 |
| Tennessee | -10000 | +5000 |
| Texas | -10000 | +1400 |
| Utah | -10000 | +2500 |
| Vermont | +5000 | -10000 |
| Virginia | +500 | -1200 |
| Washington | +2000 | -10000 |
| West Virginia | -10000 | +3300 |
| Wisconsin | -133 | +100 |
| Wyoming | -10000 | +5000 |
Chance to Win Each State
| State | Trump's Chance to Win | Harris' Chance to Win |
|---|---|---|
| Alabama | 97.12% | 2.88% |
| Alaska | 92.79% | 7.21% |
| Arizona | 75.46% | 24.64% |
| Arkansas | 96.84% | 3.16% |
| California | 3.16% | 96.84% |
| Colorado | 6.31% | 93.69% |
| Connecticut | 4.59% | 95.41% |
| Delaware | 3.74% | 96.26% |
| Florida | 90.58% | 9.42% |
| Georgia | 67.48% | 32.52% |
| Hawaii | 3.74% | 96.26% |
| Idaho | 96.26% | 3.74% |
| Illinois | 3.74% | 96.26% |
| Indiana | 96.26% | 3.74% |
| Iowa | 93.69% | 6.31% |
| Kansas | 96.26% | 3.74% |
| Kentucky | 96.84% | 3.16% |
| Louisiana | 96.26% | 3.74% |
| Maine | 10.22% | 89.78% |
| Maryland | 2.88% | 97.12% |
| Massachusetts | 3.16% | 96.84% |
| Michigan | 50.00% | 50.00% |
| Minnesota | 11.50% | 88.50% |
| Mississippi | 98.06% | 1.94% |
| Missouri | 96.26% | 3.74% |
| Montana | 93.69% | 6.31% |
| Nebraska | 95.41% | 4.59% |
| Nevada | 59.75% | 40.25% |
| New Hampshire | 15.29% | 84.71% |
| New Jersey | 6.37% | 93.63% |
| New Mexico | 10.36% | 89.64% |
| New York | 3.74% | 96.26% |
| North Carolina | 67.48% | 32.52% |
| North Dakota | 97.12% | 2.88% |
| Ohio | 93.69% | 6.31% |
| Oklahoma | 97.12% | 2.88% |
| Oregon | 5.61% | 94.39% |
| Pennsylvania | 61.81% | 38.19% |
| Rhode Island | 3.74% | 96.26% |
| South Carolina | 96.26% | 3.74% |
| South Dakota | 98.06% | 1.94% |
| Tennessee | 98.06% | 1.94% |
| Texas | 93.69% | 6.31% |
| Utah | 96.26% | 3.74% |
| Vermont | 1.94% | 98.06% |
| Virginia | 15.29% | 84.71% |
| Washington | 4.59% | 95.41% |
| West Virginia | 97.12% | 2.88% |
| Wisconsin | 53.31% | 46.69% |
| Wyoming | 98.06% | 1.94% |
Historical Accuracy of Betting Odds in Elections
Betting odds have a strong track record in predicting election outcomes — overall. Over the past 35 years, they have successfully predicted the winners in 77% of elections, according to data scientist Thomas Miller.
Betting markets are more reliable when bettors are diverse and their collective opinions are informed by a wide range of perspectives. Close elections, such as Barack Obama’s victory in 2012 and George W. Bush’s in 2000, have also been accurately predicted by betting odds, underscoring their potential reliability in forecasting electoral outcomes.
However, it’s important to note that betting odds have not always been accurate, especially of late. In the last two presidential elections, the odds favored Donald Trump on election day in 2020 and Hillary Clinton in 2016, both of which turned out to be incorrect predictions. These exceptions highlight the inherent uncertainties in political forecasting and the need to consider multiple factors.
Despite these anomalies, betting odds remain valuable for gauging public sentiment and predicting election outcomes. Their historical accuracy, combined with insights from national polls and other data, offers a comprehensive picture of the electoral landscape.
Potential Scenarios and Their Probabilities
The 2024 presidential election offers a range of potential scenarios. According to some popular projections, Donald Trump is likely to win approximately 54 out of 100 scenarios, while Kamala Harris is forecasted to win about 46 out of 100 scenarios. This competitive landscape is further highlighted by other model predictions showing Harris securing 286 electoral votes compared to Trump’s 252.
These scenarios highlight the importance of swing states and voter turnout. For instance, although it's not the most influential state in number of electoral votes, New Hampshire shows a wide range of possible outcomes, with polls indicating Harris leading by as much as 21 points in one survey and Trump ahead by two or three points in another. This variability makes it clear that the race is far from decided.
As election day approaches, staying informed about these potential scenarios and their probabilities offers valuable insights into the race’s dynamics. Understanding the factors that influence these outcomes helps voters and analysts better anticipate the final result.
How to Interpret Changes in Odds Leading Up to Election Day

Changes in betting odds can offer crucial insights into the evolving political landscape as election day approaches. Gambling companies adjust odds to balance wagers on both candidates, aiming to protect profit margins. Even small advantages in polling can lead to significant shifts in betting odds, especially in closely contested elections.
Understanding these changes requires closely monitoring polls and voter sentiment. National polls and polling averages significantly influence betting odds, but they are not the sole determinants. Campaign strategies, public appearances, and major political events can also cause fluctuations.
Interpreting these changes requires considering the broader context. A sudden shift in odds might indicate growing momentum for one candidate or reflect a reaction to a specific event. Staying informed and analyzing these trends helps better understand the likely outcomes as election day approaches.
Frequently Asked Questions
What are the current betting odds for the 2024 presidential election?
Currently, Donald Trump has betting odds of -182, translating to a 61.74% chance of winning the 2024 presidential election, while Kamala Harris has odds of +150, indicating a 38.26% chance.
How do national polls compare to betting odds for the 2024 election?
National polls indicate a tighter race for the 2024 election than prevailing betting odds, which largely favor Trump. This difference arises from close polling in critical battleground states.
What are the key swing states for the 2024 presidential election?
The key swing states for the 2024 presidential election are Arizona, Georgia, Michigan, Nevada, North Carolina, Pennsylvania, and Wisconsin, as they possess unpredictable voting patterns that could significantly influence the election outcome.
How accurate are betting odds in predicting election outcomes?
Betting odds have demonstrated a solid track record, accurately predicting winners in 77% of elections over the past 35 years, though they have faltered in the last two presidential elections. This indicates that while they can be a useful indicator, they are not infallible in forecasting electoral outcomes.
What factors influence changes in betting odds leading up to election day?
Changes in betting odds leading up to election day are primarily influenced by national polls, voter sentiment, campaign strategies, public appearances, and significant political events, with gambling companies also adjusting odds to balance wagers effectively. This multifaceted approach ensures that betting reflects current political dynamics.


