With just 11 days until the 2024 United States Presidential Election on November 5, former President Donald Trump remains a larger than 60% favorite to defeat Vice President Kamala Harris. And after Harris' odds improved slightly following her appearance in a CNN town hall on Wednesday, the numbers once again moved in Trump's favor late on Thursday night.
Let's get to my updated presidential election predictions and everything you need to know about election betting odds, from the odds on Trump or Harris to win the election to state-by-state analysis for all 50 states and even the odds on which party will win the popular vote.
Presidential Election Odds
| Presidential Candidate | Election Odds | Chance to Win |
|---|---|---|
| Donald Trump | -167 | 60.02% |
| Kamala Harris | +140 | 39.98% |
Odds are according to BetMGM UK. The "chance to win the election" percentages are based on implied probabilities with the vigorish removed. Gambling on elections isn't currently legally allowed at sportsbooks in the United States.
Election Odds for Donald Trump
Former President Donald Trump is currently a -167 favorite to win the presidential election, which gives him a 60.02% chance of victory. Trump was a -162 favorite with a 58.71% chance of victory on Thursday.
Election Odds for Kamala Harris
Vice President Kamala Harris is a +140 underdog to win the presidential election, giving her a 39.98% chance of victory. Harris was +130 with a 41.29% chance of winning prior to the latest odds movement.
Trump was a -182 favorite and Harris was a +140 underdog before Harris' Wednesday town hall. The election betting odds did not move immediately after Wednesday's televised broadcast, but on Thursday morning, the lines did move slightly in the vice president's favor, before they moved once again to the current odds of Trump -167 / Harris +140.
Presidential Election Predictions

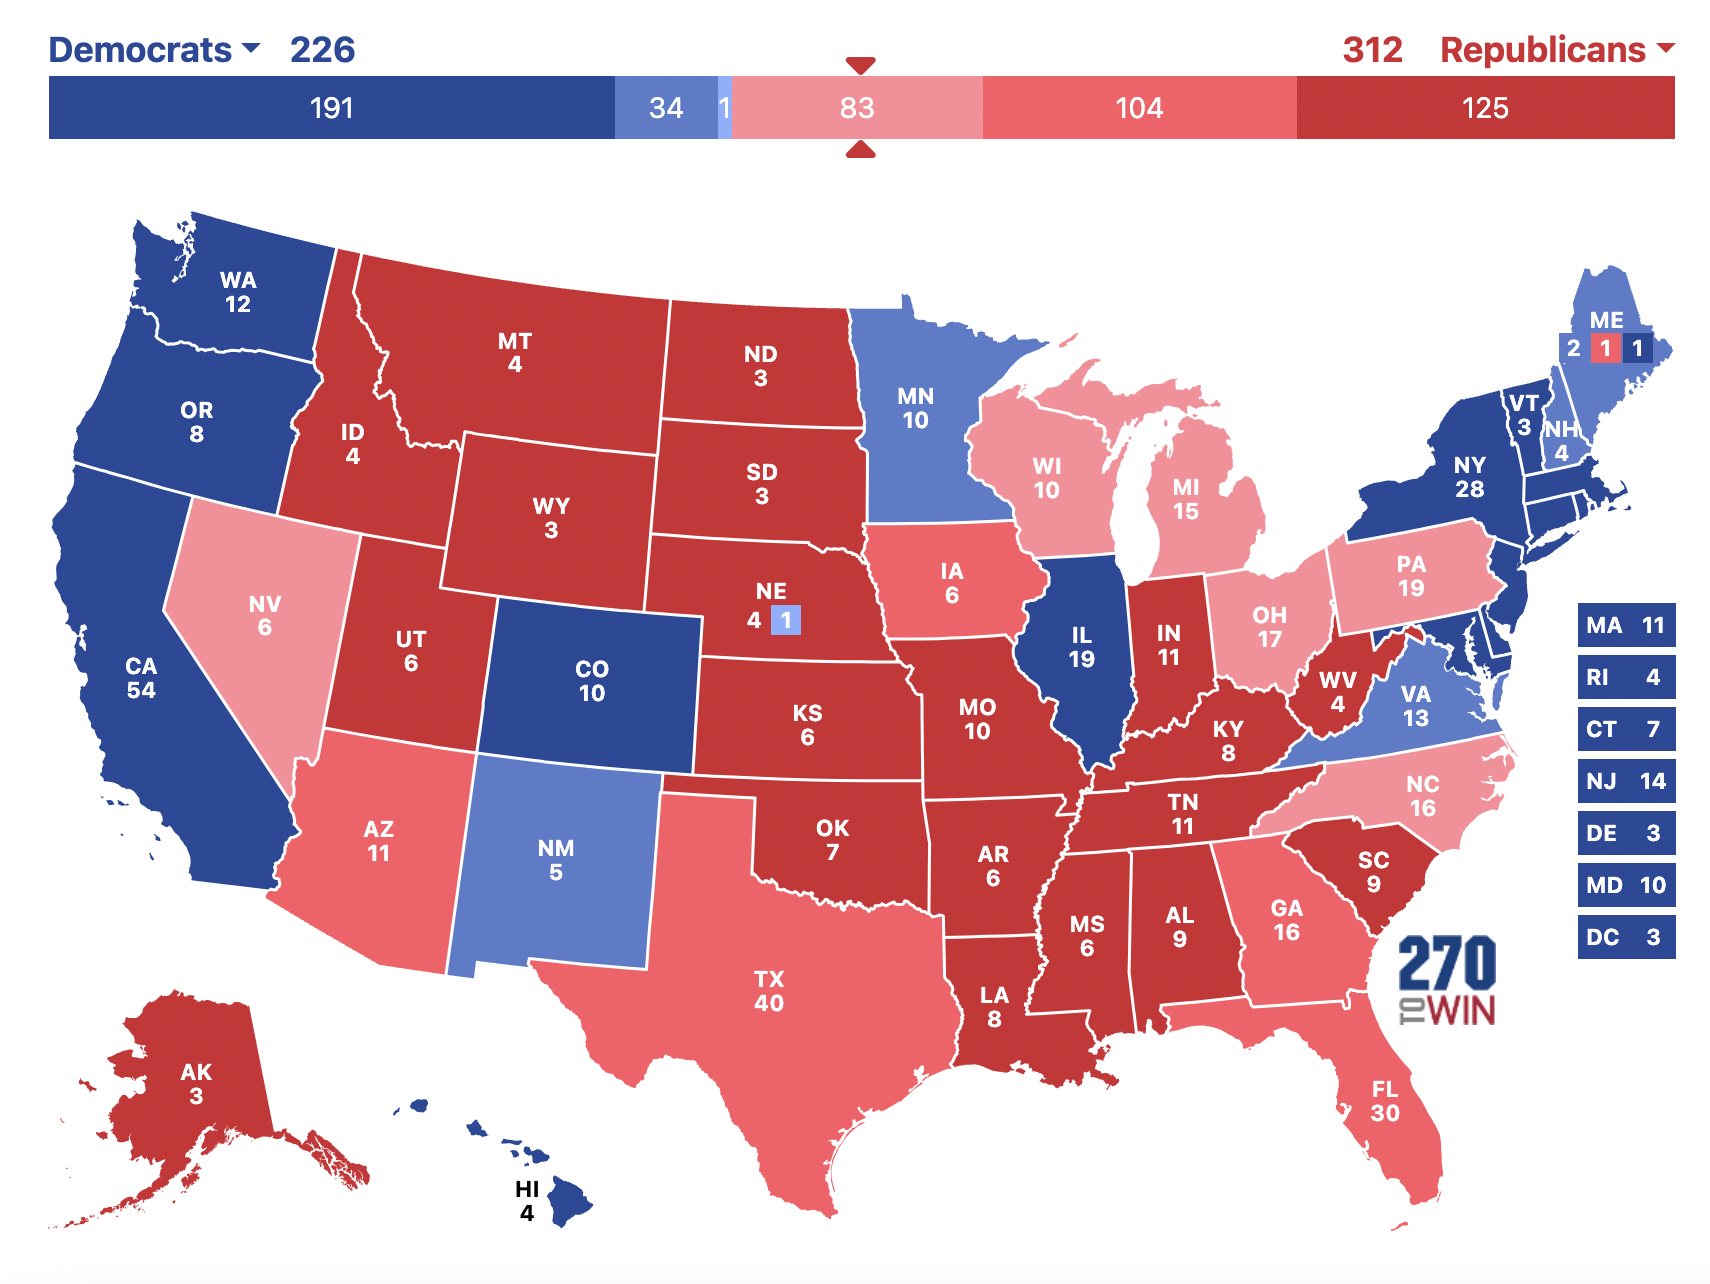
Based on the current odds, our current election prediction is for Donald Trump to win 312 electoral votes and reclaim the White House. That would surpass Joe Biden's 306 electoral votes won in 2020, as well as topping Trump's own 304 electoral votes in 2016. If Trump were to win 312 electoral votes, it would be the most votes won by a Republican since George H.W. Bush's whopping 426 votes in 1988, coming off the back of Ronald Reagan's record 525 electoral votes in 1984.
Trump also has a combined 15.16% chance of winning in a landslide of more than 329 votes, with an 11.79% chance of winning between 330 and 359 electoral votes and a 3.37% chance of winning 360+.
Overall, the electoral vote-based election predictions give Trump a 62.67% chance of victory, slightly better than his 60.77% chance based on his -182 odds.
Here are the electoral vote projections for both candidates:
How Many Electoral Votes Will Donald Trump Win?
| Trump Electoral Votes Won | Odds | Percentage Chance |
|---|---|---|
| 179 or Fewer | +2000 | 3.37% |
| 180-209 | +1000 | 6.43% |
| 210-239 | +500 | 11.79% |
| 240-269 | +350 | 15.73% |
| 270-299 | +225 | 21.78% |
| 300-329 | +175 | 25.73% |
| 330-359 | +500 | 11.79% |
| 360+ | +2000 | 3.37% |
How Many Electoral Votes Will Kamala Harris Win?
| Harris Electoral Votes Won | Odds | Percentage Chance |
|---|---|---|
| 179 or Fewer | +2000 | 3.68% |
| 180-209 | +1000 | 7.03% |
| 210-239 | +200 | 25.77% |
| 240-269 | +275 | 20.61% |
| 270-299 | +300 | 19.32% |
| 300-329 | +500 | 12.88% |
| 330-359 | +1000 | 7.03% |
| 360+ | +2000 | 3.68% |
Election Odds for Every State
Arizona, Florida, Georgia, Michigan, Nevada and North Carolina all moved in favor of Trump over the past several days, with Nevada flipping from pro-Harris to pro-Trump along the way. In the past 24 hours, Pennsylvania and Wisconsin have also seen Trump's odds improve.
| State | Odds for Trump | Odds for Harris |
|---|---|---|
| Alabama | -10000 | +3300 |
| Alaska | -10000 | +1200 |
| Arizona | -455 | +275 |
| Arkansas | -10000 | +3000 |
| California | +3000 | -10000 |
| Colorado | +800 | -2500 |
| Connecticut | +2000 | -10000 |
| Delaware | +2500 | -10000 |
| Florida | -2500 | +900 |
| Georgia | -286 | +180 |
| Hawaii | +2500 | -10000 |
| Idaho | -10000 | +2500 |
| Illinois | +2500 | -10000 |
| Indiana | -10000 | +2500 |
| Iowa | -4000 | +1000 |
| Kansas | -10000 | +2500 |
| Kentucky | -10000 | +3000 |
| Louisiana | -10000 | +2500 |
| Maine | +650 | -1800 |
| Maryland | +3300 | -10000 |
| Massachusetts | +3000 | -10000 |
| Michigan | -137 | +100 |
| Minnesota | +800 | -2000 |
| Mississippi | -10000 | +5000 |
| Missouri | -10000 | +2500 |
| Montana | -10000 | +1400 |
| Nebraska | -10000 | +2000 |
| Nevada | -182 | +130 |
| New Hampshire | +550 | -1400 |
| New Jersey | +1400 | -5000 |
| New Mexico | +1200 | -5000 |
| New York | +2500 | -10000 |
| North Carolina | -286 | +180 |
| North Dakota | -10000 | +3300 |
| Ohio | -5000 | +1200 |
| Oklahoma | -10000 | +3300 |
| Oregon | +1600 | -10000 |
| Pennsylvania | -150 | +120 |
| Rhode Island | +2500 | -10000 |
| South Carolina | -10000 | +2500 |
| South Dakota | -10000 | +5000 |
| Tennessee | -10000 | +5000 |
| Texas | -10000 | +4000 |
| Utah | -10000 | +2500 |
| Vermont | +5000 | -10000 |
| Virginia | +500 | -1000 |
| Washington | +2000 | -10000 |
| West Virginia | -10000 | +3300 |
| Wisconsin | -133 | +100 |
| Wyoming | -10000 | +5000 |
Chance to Win Each State
| State | Trump's Chance to Win | Harris' Chance to Win |
|---|---|---|
| Alabama | 97.12% | 2.88% |
| Alaska | 92.79% | 7.21% |
| Arizona | 75.46% | 24.64% |
| Arkansas | 96.84% | 3.16% |
| California | 3.16% | 96.84% |
| Colorado | 10.36% | 89.64% |
| Connecticut | 4.59% | 95.41% |
| Delaware | 3.74% | 96.26% |
| Florida | 90.58% | 9.42% |
| Georgia | 67.48% | 32.52% |
| Hawaii | 3.74% | 96.26% |
| Idaho | 96.26% | 3.74% |
| Illinois | 3.74% | 96.26% |
| Indiana | 96.26% | 3.74% |
| Iowa | 91.48% | 8.52% |
| Kansas | 96.26% | 3.74% |
| Kentucky | 96.84% | 3.16% |
| Louisiana | 96.26% | 3.74% |
| Maine | 12.34% | 87.66% |
| Maryland | 2.88% | 97.12% |
| Massachusetts | 3.16% | 96.84% |
| Michigan | 53.62% | 46.38% |
| Minnesota | 10.45% | 89.55% |
| Mississippi | 98.06% | 1.94% |
| Missouri | 96.26% | 3.74% |
| Montana | 93.69% | 6.31% |
| Nebraska | 95.41% | 4.59% |
| Nevada | 59.75% | 40.25% |
| New Hampshire | 14.15% | 85.85% |
| New Jersey | 6.37% | 93.63% |
| New Mexico | 10.36% | 89.64% |
| New York | 3.74% | 96.26% |
| North Carolina | 67.48% | 32.52% |
| North Dakota | 97.12% | 2.88% |
| Ohio | 92.72% | 7.28% |
| Oklahoma | 97.12% | 2.88% |
| Oregon | 5.61% | 94.39% |
| Pennsylvania | 62.69% | 37.31% |
| Rhode Island | 3.74% | 96.26% |
| South Carolina | 96.26% | 3.74% |
| South Dakota | 98.06% | 1.94% |
| Tennessee | 98.06% | 1.94% |
| Texas | 91.48% | 8.52% |
| Utah | 96.26% | 3.74% |
| Vermont | 1.94% | 98.06% |
| Virginia | 15.49% | 84.51% |
| Washington | 4.59% | 95.41% |
| West Virginia | 97.12% | 2.88% |
| Wisconsin | 53.31% | 46.69% |
| Wyoming | 98.06% | 1.94% |
Which Party Will Win the Presidential Election?
| Party | Odds | Chance to Win |
|---|---|---|
| Republicans | -167 | 59.45% |
| Democrats | +140 | 39.61% |
| Independent/Any Other Party | +10000 | 0.93% |
If we zoom out from the candidates and just look at the Democratic and Republican parties, the odds on who will win the White House in November effectively remain the same. The Republicans are -167, just like Donald Trump, while the Democrats are +140, just like Kamala Harris.
The only difference between these odds and the straight-up Trump vs. Harris odds is the inclusion of the chance of an Independent or third-party candidate winning the election at 100-to-1 odds.
Odds for Winning Party of 2024 Popular Vote
| Party | Odds | Chance to Win |
|---|---|---|
| Democrats | -300 | 68.60% |
| Republicans | +200 | 30.49% |
| Independent/Any Other Party | +10000 | 0.91% |
The Democrats are still heavy favorites to win the popular vote, but their -300 odds are much lower than the -700 odds Harris & Co. enjoyed shortly before the 2024 Democratic National Convention.
Days Until Presidential Election, Key Dates and Events to Watch
There are 11 days until the 2024 United States Presidential Election on Nov. 5. Many states are already allowing early voting and voting by mail.
Counting ballots will take weeks in some states, and the results must be certified by Congress, a process that can be contentious. The new president will be sworn into office on the steps of the Capitol building in Washington, D.C., on Jan. 20, marking the culmination of this intense electoral process.
Keep in mind the winner of the United States presidential election is decided by which candidate gets the 270 electoral votes necessary to win the Electoral College, not who wins the national popular vote. Those electoral votes are allocated on a state-by-state basis, based on the number of members of the House of Representatives, plus the two members of the Senate in each state, with Washington, D.C., also having three electors, for a total of 538 electoral college votes.
That means that 270 electoral votes is the minimum number needed to win the majority of the votes.


