In 2020, I hypothesized that defense is the most overlooked aspect of preseason baseball analysis. I attempted to prove that suspicion by demonstrating a correlation between the end-of-season defensive value accumulated by a team and whether that team went over or under their listed win total.
After comparing the three-year data samples of Outs Above Average ("OAA") and Defensive Runs Saved ("DRS"), I concluded that "the better the team defense, the more likely that team went Over its listed win total," but I couldn't apply that same trend to weak defensive teams and Unders.
Despite playing just 37% of a full regular season (60 of 162 games), those trends largely held over the shortened 2020 schedule, even though teams didn't have a full year for those metrics to stabilize.
I'll make some caveats to adjust for the 2020 sample, but let's look at the data:
From 2017-2019, "Over" teams finished with an average DRS of 28.5 and an average OAA of 7.3, while "Under" teams finished with an average DRS of -6.4 and an average OAA of -3.3.
Despite the shorter sample of games in 2020, those positive and negative averages were apparent yet again; but as usual, they weren't necessarily true at the extremes.
To address one previous outlier, if you remove the league-leading defense of the Arizona Diamondbacks from the 2018 sample, “Under” teams would have finished with an average of -3.2 DRS (5.7 actual) and -6.9 OAA (-4.5 actual). And based on their Pythagorean record (86-76), those 2018 Diamondbacks should have exceeded their listed win total (85).
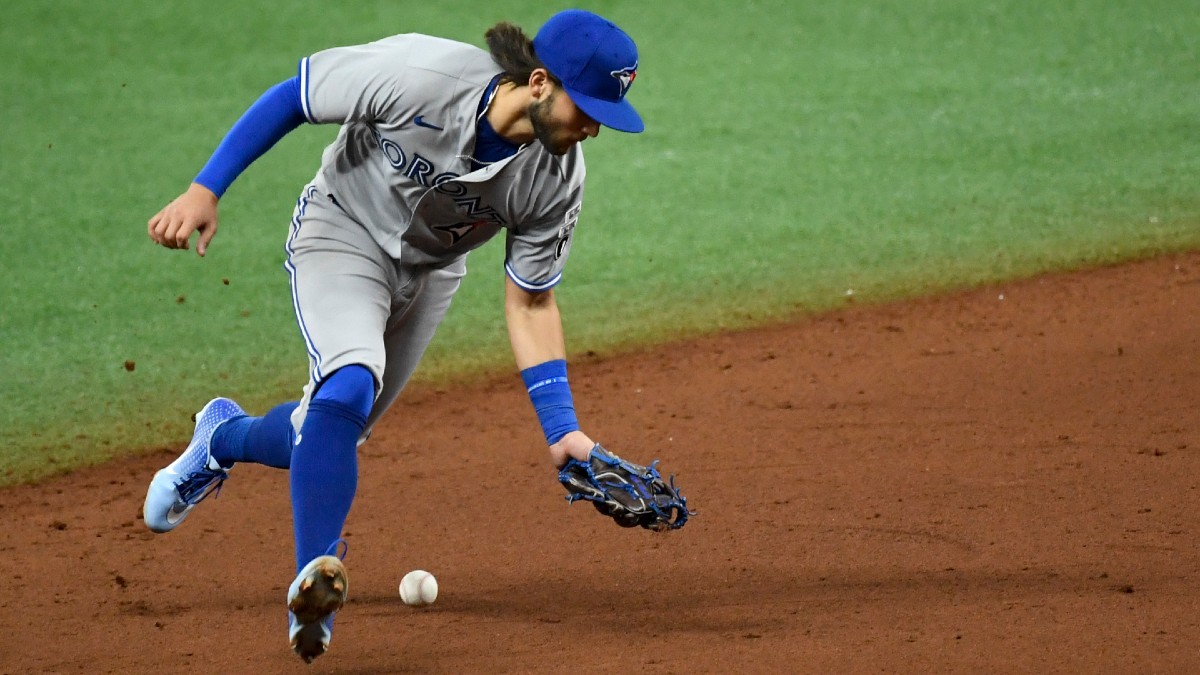
Comparatively, the 2020 Toronto Blue Jays (-39 DRS, -17 OAA) finished 29th out of 30 teams by both defensive metrics while overachieving relative to their Pythagorean record (29-31) record by three wins. If you remove Toronto from the 2020 sample, the remaining "Over" teams finished with an average of 8.1 DRS and 3.4 OAA.
And if you remove the St. Louis Cardinals, the best defensive team in baseball by DRS, from 2020's "Under" sample, the averages for the underachieving teams drop to -5.7 DRS and -1.9 OAA.
Good and Bad Defensive Teams
Over the past four seasons, 13 of the 16 teams (81.2%) who finished in the top or bottom five by both DRS and OAA performed as expected relative to their win total.
The three exceptions include the 2018 Arizona Diamondbacks and the 2017 Cincinnati Reds — both of whom should have surpassed their win totals based upon the Pythagorean record — and the 2020 Blue Jays, who overachieved by three wins in a 60 game sample and likely would have regressed during a full season.
Furthermore, finishing in the top three by either one of DRS or OAA has indicated an 88% chance that team surpassed its win total. However, finishing in the bottom three by either metric only indicated a 67% likelihood that team fell short of its win total.
Ranking in the top 10 or bottom 10 in either defensive metric has had a 62-64% correlation to the over or under, respectively.
There is certainly a correlation in the aggregate, to reiterate my earlier point, even if it isn't always necessarily true at the extremes. But the better the defense, the more likely it is that that team went Over its win total.
Win Total Outliers
We have shown that, on average, teams that outperform their win total are above average defensively, and teams that underperform are generally below average defensively.
How does this information correlate as a team’s performance moves further away from that projected total — whether for good or bad?
I set the outlier boundary at plus or minus 8.5 wins for 2017-19 and narrowed the gap to plus or minus 5 wins for the shortened 2020 season. This ensured that the top- and bottom-four over- and under-achievers — in terms of end-of-season wins compared with preseason listed totals — were all captured:
As you can see, teams at the extremes in terms of win total performance trended towards the heights and depths in defensive performance — with the middle two-thirds of the league splitting the difference each of the past four seasons.
Clearly, there is a strong correlation between defensive quality and teams over- or under-performing compared to their win projection.
2021 Projections
Based upon the fielding ratings from FanGraphs' Depth Chart projections, here are the best and worst expected defensive teams heading into the 2021 season:


