


In part two of our Feeling the Heat assessment, we look at how weather affects baseball games. We've already seen how the elements can wreak havoc in NFL cities. Now we look at how varying conditions can help or hurt MLB teams.
Players know adaptability is paramount, particularly when the unexpected occurs. Who can forget the trash-blowing dust storm and rain that hit Game 7 of the 2001 World Series between the Diamondbacks and Yankees? Heralded as one of ESPN’s games of the decade, it was made all the more memorable by the bizarre Arizonan weather.
With this in mind, we’ve looked into which MLB cities experience the worst weather. Analyzing data over the duration of last year’s playing season, we’ve found out which open-roof stadiums are most affected by tough conditions.
We also spoke to meteorologist Kevin Roth for an expert explanation of exactly how these adverse weather conditions can affect a game.
Feeling the Wind
When it comes to wind, Kevin explains: “The orientation of the wind over the stadium can either help carry a ball over the fences or knock a would-be home run ball down.
Winds blowing out from home to center, especially 15mph or stronger, are beneficial to hitters, while winds blowing from center to home are detrimental to hitters.
Winds are also very stadium specific, with each ballpark reacting differently to wind. A 15mph wind blowing out in a wind-sensitive park like Wrigley increases HR's by over 50%, but the same 15mph wind blowing out in San Francisco (where the park was designed to minimize wind) only increases HR's by less than 10%”.
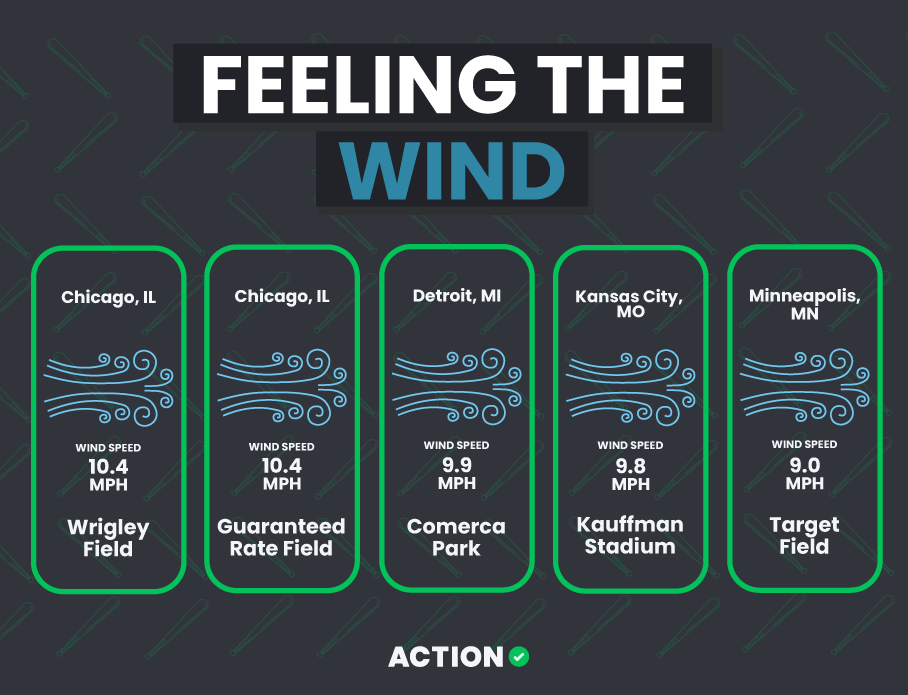
Looking at the windiest cities, our data shows us that Chicago – to no surprise – has the highest wind speed at 10.4 MPH. At the start of the season in April, winds hit as high as 12.4 MPH.
While Chicago has the highest winds, other MLB cities affected by gust-hit games are:
- Detroit (Comerica Park) – 9.9 MPH
- Kansas City (Kauffman Stadium) – 9.8 MPH
- Minneapolis (Target Field) – 9 MPH
Feeling the Rain
In terms of rainfall, Kevin states that delays are the biggest issue.
“While teams are generally willing to play through light rain, any heavy rain or lightning will cause a weather delay. This can lead to postponed games, as well as scenarios where an early delay can knock out a starting pitcher”.
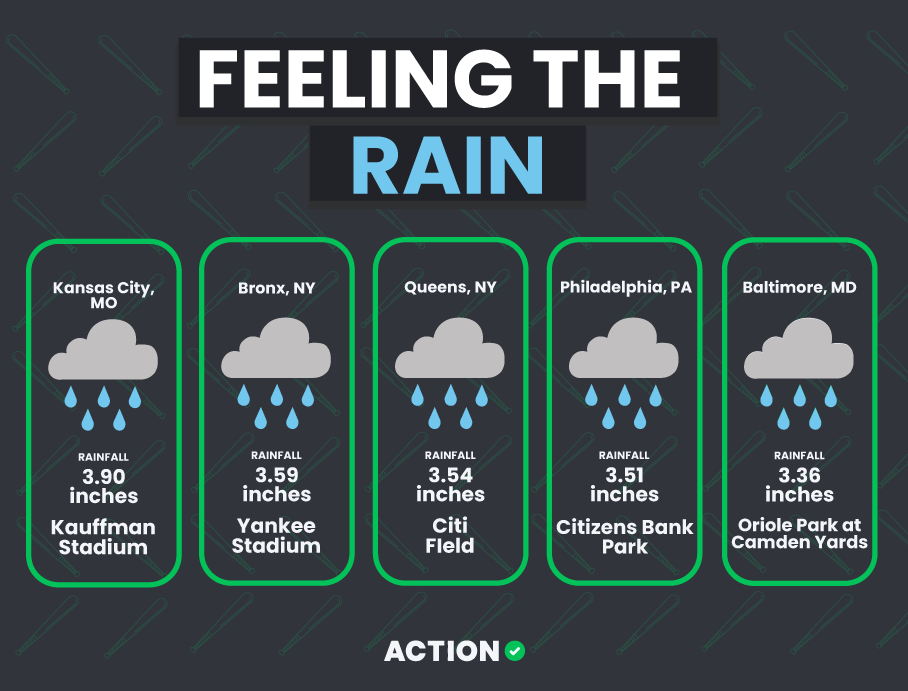 Hit by the most rain last year was Kansas City, with an average of 3.9 inches of rainfall falling through Kauffman Stadium’s open roof. June was the worst month for rainfall last year, with Kansas City Royals dealing with almost five inches of rain.
Other MLB cities hit by heavy rainfall last season include:
- Bronx (Yankee Stadium) – 3.59 inches
- Queens (Citi Field) – 3.54 inches
- Philadelphia (Citizens Bank Park) – 3.51 inches
- Baltimore (Oriole Park at Camden Yards) – 3.36 inches.
Feeling the Heat
Temperature is another major component to factor in for optimum gameplay, according to Kevin.
“Hot air is thin air, and thin air allows a hit ball to carry farther. Conversely, the colder it is outside, the more dense the air is. That dense air in cold temperatures adds more air resistance to a ball as it's flying through the air. The difference between a 90 degree day and a 60 degree day can be the difference between a home run and warning track power.
The air density (and thus the temperatures) also plays a role in how pitches break. Hot, thin air means less break on off-speed pitches, whereas a ball will break more on a cold day because it has more air resistance to help it move. That means cold weather is better for pitchers because the ball is both harder to hit and won't carry as far when it's hit, and hot air is better for batters because a pitch is easier to hit and carries farther.”
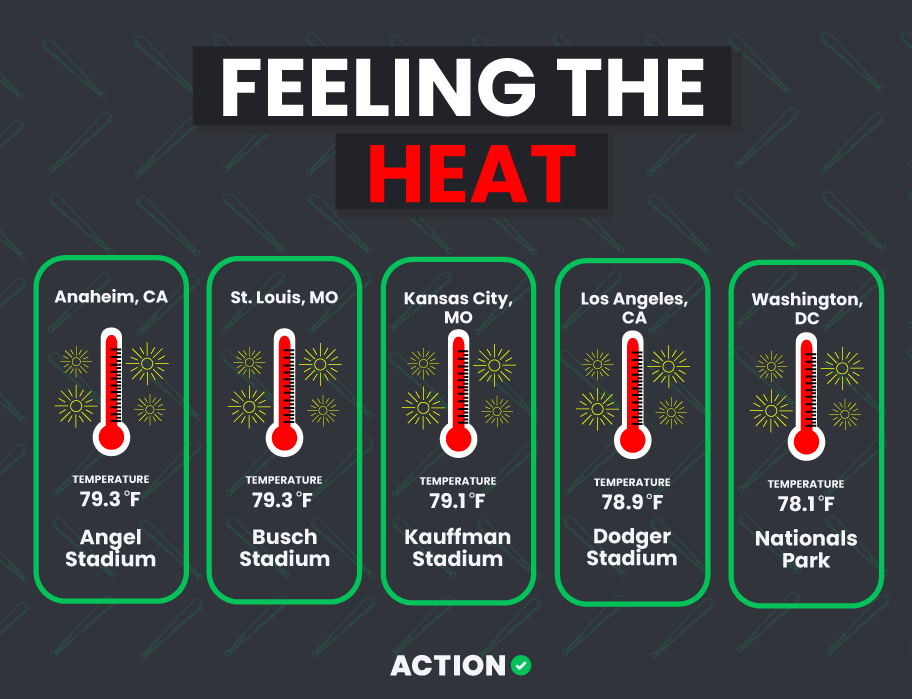
Our data shows that Anaheim and St. Louis both experienced the highest temperatures last season, reaching an average of 79.3°F. Temperatures in LA hit as high as 85°F last August, while St. Louis felt the same in June.
Also dealing with the hottest weather per season are:
- Kansas City (Kauffman Stadium) – 79.1°F
- Los Angeles (Dodger Stadium) – 78.9°F
- Washington D.C. (Nationals Park) – 78.1°F
Feeling the Cold
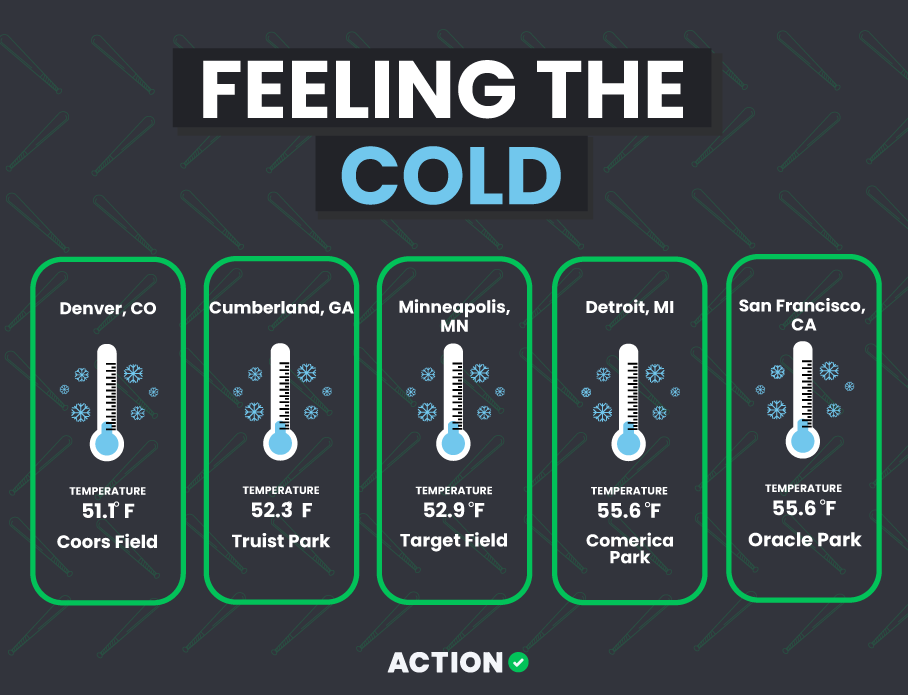
With a chilly average temperature of 51.1°F, Denver was the coldest MLB city last season. Its coldest month was April, when temperatures hit as low as 39°F.
Other cities that felt the cold the most are:
- Cumberland (Truist Park) – 52.3°F
- Minneapolis (Target Field) – 52.9°F
- Detroit (Comerica Park) – 55.6°F
- San Francisco (Oracle Park) – 55.6°F
Elevation
And, while not strictly a weather variable, Kevin also states that elevation is important to consider for how well a ball carries.
“Games played at high elevation have thinner air and less air resistance on a ball, allowing a well hit ball to carry farther than it would at sea level. This is why Coors park is consistently one of the better home run parks in baseball every year.”
Weather is so varied across the US, players must regularly adapt their gameplay throughout the MLB season. So, don’t forget to check the forecast before placing your bets! Check out the current MLB betting odds now and find more MLB odds, news and analysis from the experts here at Action Network.
Be sure to take advantage of great new user promotional offers from sporstbooks like Caesars, FanDuel, BetMGM, and more as the season heads into its home stretch!
Methodology
To determine which MLB franchises are most affected by the weather, we
recorded temperature, snowfall, rainfall, and wind speed data for each US
location where there’s an MLB stadium. Data was collected for the period March 2021 – October 2022 (the duration of the MLB regular season). We then ranked the data accordingly, the reveal the teams most impacted by the heat, cold, rain, and wind.


