Baseball can be fickle game to bet on. The season is long, it's a daily grind with a lot of ups and downs during the summer. One week you are on top of the world and it seems like you have the game figured out. Then the next week, you can't hit a bet and you never want to see a baseball ever again. It's torturous love affair we all have betting on America's pastime.
The purpose of this article is to take you through how I handicap MLB games and highlighting key factors I always look at before placing a bet.
Projections
I am a huge believer in projections and they're my starting point for not only betting baseball, but every sport. Baseball was the first sport I started modeling back in 2015 when I was sitting in my cubicle in a dimly lit office as an accountant just trying to pass the time.
I cannot stress to you enough how important projections are in a sport like baseball because it is the rare sport that can be mathematically projected given the fixed number of outputs a single event. Projections can also take into account park factors, wind, temperature, etc.
Over the years, I have learned a lot about what works and what doesn't when it comes to projecting MLB. If you'd like to read the finer details about how I individually project MLB games, you can do so here.
However, my projections aren't for public consumption because we already have a baseball genius at the Action Network in Sean Zerillo, whose projections have an incredible ROI over the past several years. So, if you aren't already an Action Pro subscriber, you can sign up here to get access to Sean's projected odds for every MLB game this season.
I start with my projected line and compare it to the odds the book is offering. If the bet I am making has 3.5% edge of expected value, then I move on to the next few steps that I will detail below.
But before we move on, let me go into a little detail about what I mean by 3.5% of expected value.
Let's say the Yankees and Gerrit Cole are -190 against Nathan Eovaldi and the Red Sox, who are +175 on Opening Day. My model has the Yankees projected as -147 and the Red Sox at +147.
So, if we take the implied odds of +147, which equals 40.43% minus the implied odds of +175, which equals 36.36%, then I have 4.06% of expected value on the Red Sox.
After I see my bet has expected value, I compare my projected line to what Sean Zerillo has to ensure I am not way off on a certain line. If all is good, then I move on to a few more checks before placing a bet.
Left/Right Splits
After I am showing projected value on a certain line, whether it be a moneyline, over/under, team total, etc., I always go and check how certain teams do versus left- or right-handed pitchers.
FanGraphs makes it easy to split team stats into a bunch of different options like "vs. Left" or "vs. Right."
Here is an example of where each team finished the season last season against left-handed pitching (via FanGraphs):
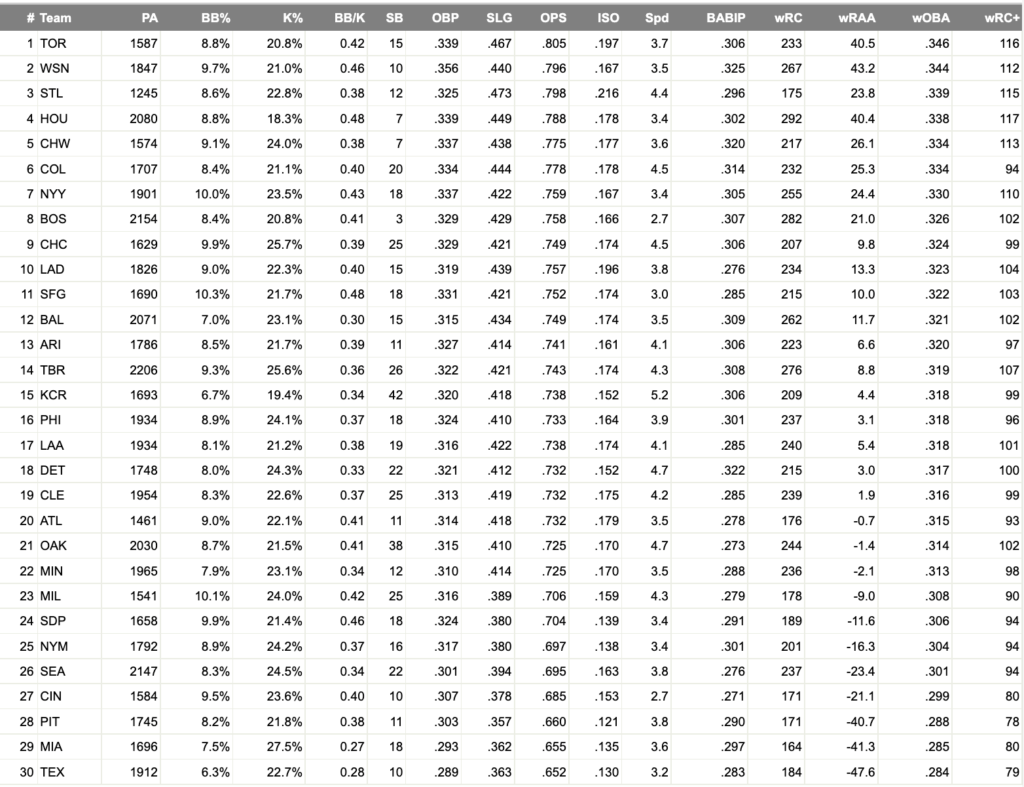
Now, there is a ton of things to look at here, but I want to point your attention to the final two columns: wOBA & wRC+. These are the best and most important "catch-all" offensive statistics you can find on the public market.
Here is the textbook definition of both:
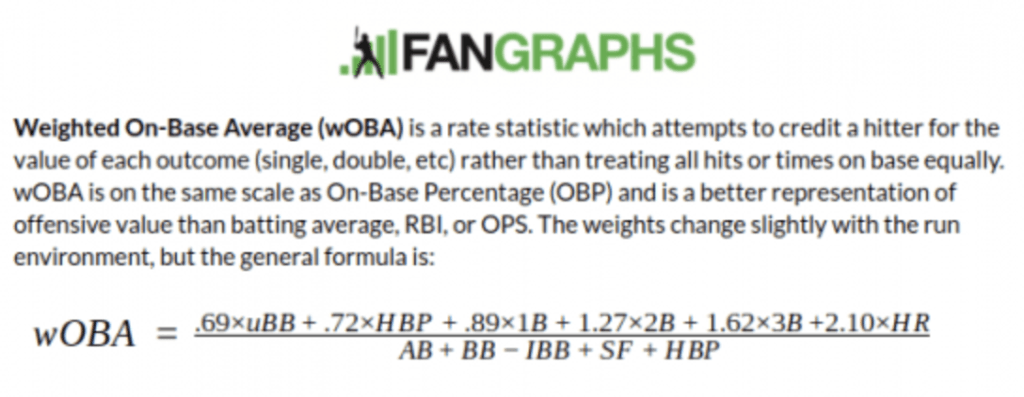
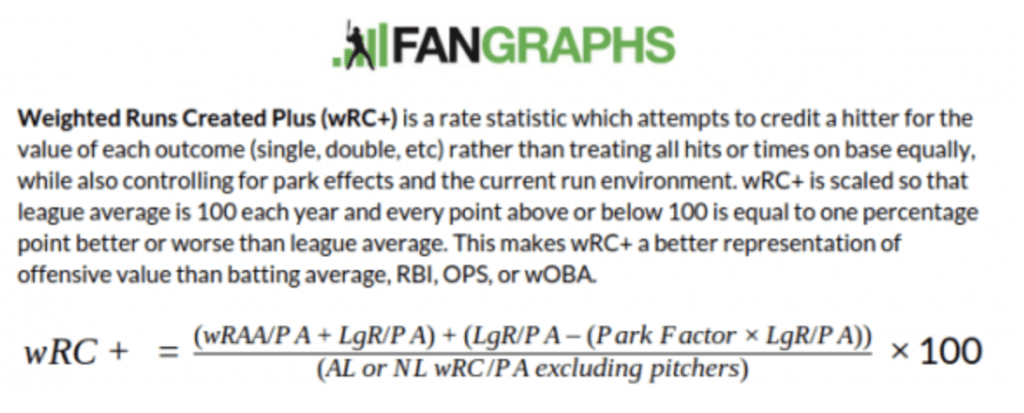
If I have value on a team, but it is facing a lefty starter and that team is terrible against left-handed pitching — for example, the Cincinnati Reds last season had a .299 wOBA and 80 wRC+ against southpaws — I will often pass on betting on that team.
Pitch Values
I have found that knowing which pitch types certain teams have success against and which pitch types they struggle against is vital to handicapping baseball. For me, this is as make-or-break as how teams perform versus left- or right-handed pitching.
Pitch Value definition (FanGraphs):
"Pitch values are about the change in run expectancy against various pitches, or the production against those pitches. A score of zero is average, with negative scores being below average and positive scores being above average for both hitters and pitchers. A positive outcome for a hitter is equally negative for the pitcher, but the numbers are calculated so that positive values equate to positive outcomes."
Here are the pitch values from 2021 via FanGraphs:
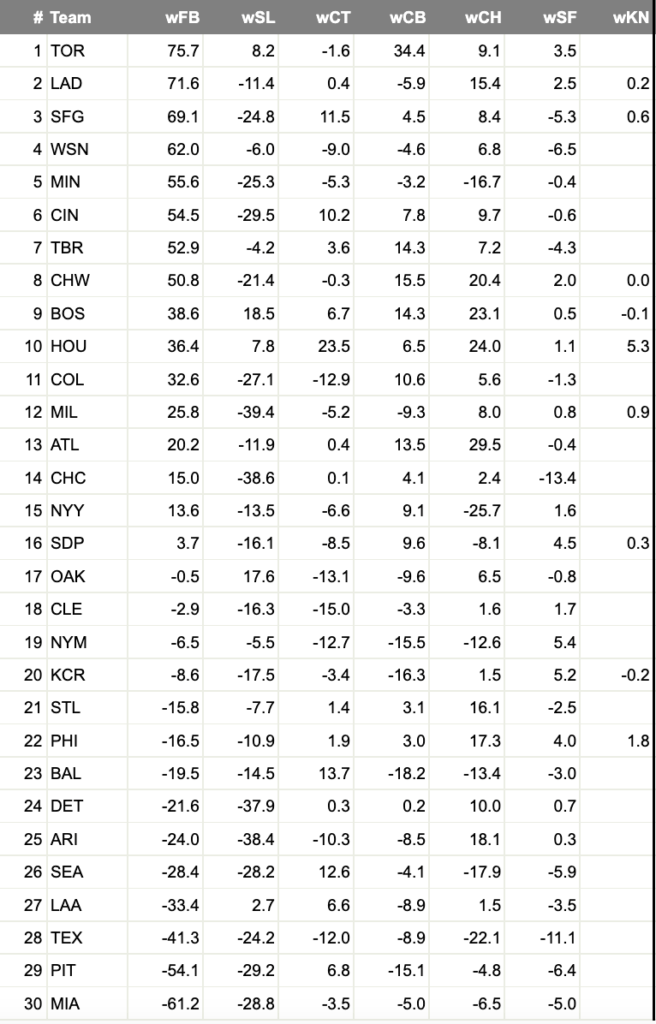
For example, lets say I am showing value on the Milwaukee Brewers against the Mariners with Robbie Ray on the mound. Since the Brewers were quite literally the worst team against sliders last year with a -39.4 run value and were 23rd in wOBA against lefties, I would most likely pass on making a bet on them, unless the opposing matchup of the Mariners' offense against the Brewers starter was just as bad.
Starting Pitchers & Expected Indicators
One of the things I always like to check for with starting pitchers is their regression stats. While my projections do use xERA (expected ERA) to calculate a pitchers projection once we reach a certain point in the season, it's always good to know which starters are due for positive or negative regression.
For example, Marco Gonzales of the Mariners finished with a 3.96 ERA in 2021, but his xERA was all the way up at 5.16, indicating that going forward he is going to regress toward his expected numbers.
On the flip side, Eduardo Rodriguez finished the regular season with a 4.74 ERA, but his xERA was 3.50. So Rodriguez would be a pitcher who I would be looking to bet on this upcoming season.
Another important thing I like to look at is how a starting pitcher's arsenal matches up against the opposing lineup and whether or not their strengths/weaknesses give me any pause about placing a potential bet.
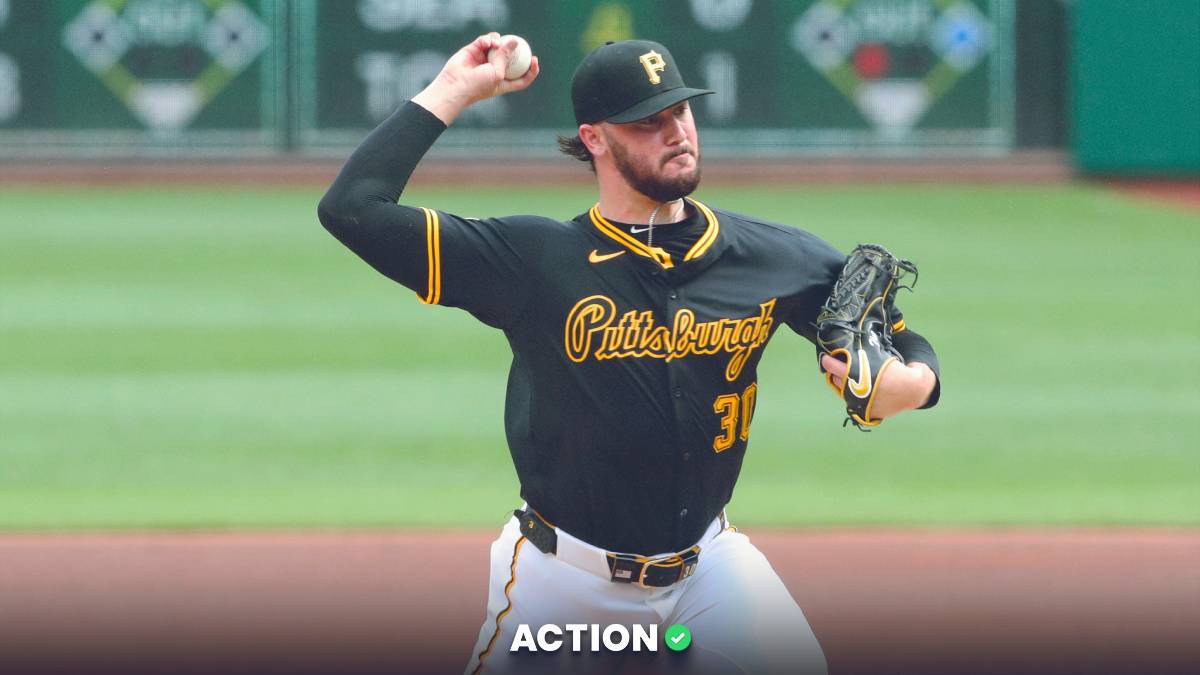
Let's take, for example, Pittsburgh Pirates starting pitcher Mitch Keller:

What I noticed first off is Keller is a fastball-heavy pitcher, going to his four-seamer 56.7% of the time in 2021. I am also noticing that he struggled with said fastball, allowing a .390 wOBA, but more importantly, his xwOBA (expected wOBA) allowed was .368, indicating that hitters over-performed against it.
xwOBA definition:
Expected Weighted On-base Average (xwOBA) is formulated using exit velocity, launch angle and, on certain types of batted balls, Sprint Speed.
So, let's say, for example, that I have value on the Pirates as big underdogs on the road against the Blue Jays with Keller on the mound. I may reconsider or reduce my unit bet on Pittsburgh in half because of Keller being so fastball heavy against the best lineup in MLB against right-handed pitching and fastballs.
Summary
MLB can be a difficult game to beat given how long the grind is over 162 games. However, using projections, along with matchup-based statistics, really does help when handicapping baseball and can help you turn a profit in 2022.


