Every two weeks during the MLB season, Action Network’s Tanner McGrath will compile a notebook of observations, analytical findings and actionable information to help bettors find an edge in the daily grind of betting a 162-game season.
Over the past few seasons, I’ve written an annual midway MLB betting trends piece, analyzing the most/least profitable teams on the moneyline, spread and over/under to that point in the year.
Given I needed a topic for this week’s Bettor’s Notebook, I thought I’d repurpose my old idea for this column. Coming off the All-Star break is an excellent time to do so.
To commemorate the first half and look forward to the second, let’s discuss the most unusual, profitable and avoidable betting trends from the season so far while considering whether following or fading those would be strong indicators of things to come.
As an aside, I couldn’t write this without Action Network’s Sports Insights subscription, which allowed me to build the systems you’ll read about below. Action’s Bet Labs has the data and tools to analyze historical betting trends from every possible angle.
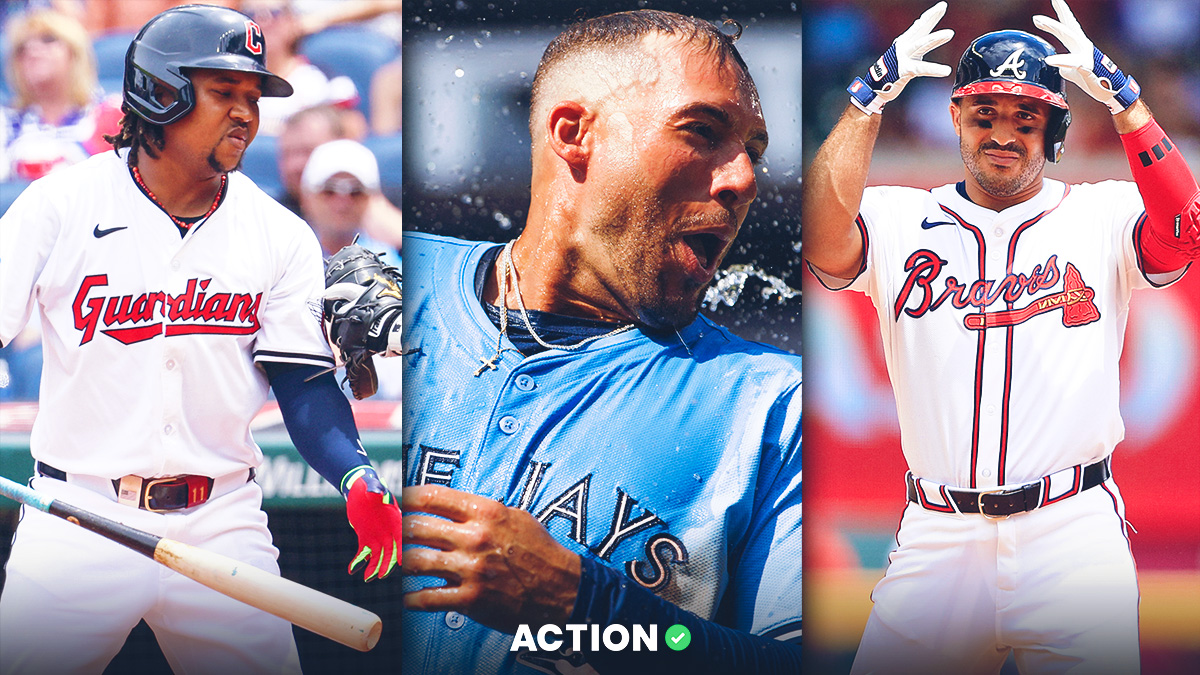
It shouldn’t be too surprising that the Guardians are MLB’s most profitable team through 100-ish games.
They’ve been the story of the summer. The Guardians hold the American League’s second-best record and third-best run differential (+84) in a surprisingly rugged AL Central – the Twins and Royals are good, too.
There’s a straightforward explanation for their success, which I wrote about in-depth in a past edition of this column. The offseason changes to Progressive Field have drastically increased its Park Factors.
| Progressive Field Season | Park Factor (MLB Rank) | HR Factor (MLB Rank) | Double Factor (MLB Rank) |
|---|---|---|---|
| 2024 | 103 (7th) | 120 (4th) | 114 (4th) |
| 2023 | 94 (28th) | 67 (30th) | 110 (6th) |
| 2022 | 96 (26th) | 87 (23rd) | 93 (27th) |
The Guardians created a home-park wind tunnel carrying fly balls too far by cutting back bleachers in the upper decks and removing shipping containers that served as corporate boxes.
For example, check out this Jose Ramirez home run off Bailey Ober on May 18:
This batted ball had a 93 mph exit velocity and a 25-degree launch angle, flying 346 feet over the right-field wall.
Only two other balls have been hit over the prior three seasons at Progressive Field with this velocity and launch angle combination.
This 320-foot right-field flyout by Gary Sanchez:
And this 331-foot center-field flyout by Bobby Witt Jr.:
The Guardians are getting an extra 15-to-25 feet of carry on their home-park fly balls. Cleveland’s lineup structure exacerbates these changes, as the Guardians are a pesky, contact-based lineup rather than a hard-hitting one. Jose Ramirez is a metronomic power presence in the middle of the order, but much of the team’s offensive prowess comes from Steven Kwan and other bat-to-the-ball slappers.
From 2021 to 2023, the Guardians paired the second-lowest strikeout rate (20%) with the lowest hard contact rate (28%), hitting the third-fewest homers (454) during the stretch.
This season, the Guardians pair the fifth-lowest strikeout rate (20%) with the seventh-lowest hard contact rate (30%) yet rank 14th in homers (109) and 15th in doubles (161). They no longer have to generate extra power from bat speed — they just have to make similar levels of fly-ball contact and let Progressive Field do the rest. The split between their Statcast metrics and actual production makes sense now.
| 2024 Stat | Mark | MLB Rank |
|---|---|---|
| fWAR | 13.8 | 11th |
| wRC+ | 103 | 12th |
| wOBA | .310 | 12th |
| SLG | .399 | 15th |
| OPS | .712 | 12th |
| ISO | .158 | 11th |
| Hard-Hit Rate | 35% | 30th |
| Barrel Rate | 6.2% | 29th |
| Avg. Exit Velocity | 88 mph | 30th |
All that said, I think the Guardians could be a fade team in the second half.
While Cleveland’s lineup has profited from the changes to its home park, the Guardians’ rotation has taken a hit. Their rotation is filled with guys who have historical home run problems.
| Guardian Pitcher | Career HR/FB | Career HR/9 | Career GB% |
|---|---|---|---|
| Tanner Bibee | 10.3% | 1.06 | 36.6% |
| Ben Lively | 13.6% | 1.58 | 39.3% |
| Logan Allen | 14.2% | 1.44 | 42.7% |
| Carlos Carrasco | 14.2% | 1.14 | 47.6% |
| Triston McKenzie | 13.0% | 1.49 | 33.0% |
Since the start of 2021, Cleveland’s starters have forced the ninth-lowest ground-ball rate among MLB rotations (40%), paired with the 11th-highest fly-ball rate (38%). From 2021 to 2023, the Guardians rotation had MLB’s fourth-lowest HR/FB rate (12%) – they have MLB’s second-highest mark this season (14%).
While the Guardians have MLB’s best bullpen by fWAR (5.1), they have MLB’s second-worst rotation (3.1). I’ll be very worried if they don’t get a ground-ball pitcher in the rotation at the deadline.
For what it’s worth, Payoff Pitch co-host Sean Zerillo and I both took Twins AL Central futures in the past week (+280, DraftKings).
Minnesota’s lineup is dangerous and dynamic, especially with Brooks Lee being called up from Triple-A. The Twins also have a high-upside bullpen (Jhoan Duran, Griffin Jax) and rotation (Joe Ryan, Pablo Lopez).
The Guardians are vulnerable, and the Twins are ready to soar.
Here are the other uber-profitable ML squads so far this season:
| 2024 Team | ML Record | Profit (Units) | ROI (%) |
|---|---|---|---|
| Guardians | 59-39 | +12.8 | +13.1% |
| Brewers | 57-24 | +10.1 | +10.2% |
| Nationals | 47-53 | +10.1 | +10.0% |
| Orioles | 60-39 | +8.5 | +8.6% |
| Phillies | 63-36 | +8.5 | +6.8% |
Similarly, nobody should be surprised that the White Sox hold their esteemed position at 2024’s halfway mark.
It won’t improve, especially if stud pitchers Garrett Crochet and Erick Fedde are dealt.
Here are some other notable ML underperformers:
| 2024 Team | ML Record | Profit (Units) | ROI (%) |
|---|---|---|---|
| White Sox | 27-75 | -34.9 | -33.6% |
| Marlins | 35-64 | -16.9 | -17.0% |
| Blue Jays | 45-54 | -14.1 | -14.3% |
| Rangers | 47-52 | -9.3 | -9.4% |
| Braves | 54-44 | -9.0 | -9.2% |
I’m most interested in the Blue Jays and Braves among this group, as these are two of the unluckiest lineups in baseball.
Let’s start with Toronto, which has the fifth-biggest negative differential between average and expected average (.237 average, .246 expected average).
Vladimir Guerrero Jr. is amidst a horrific batted-ball-luck season. He leads the league in hard-hit balls (176) yet has a .490 slugging to show for it – the guys right behind him include Shohei Ohtani (.638 SLG), Juan Soto (.575 SLG) and Bobby Witt Jr. (.575 SLG).
Similarly, Bo Bichette has continued posting elite contact numbers but has experienced a drastic decrease in his BABIP, resulting in a career-worst season. He’s a career .340 BABIP guy because of his elite bat-to-ball skills, but nothing is getting down this year.
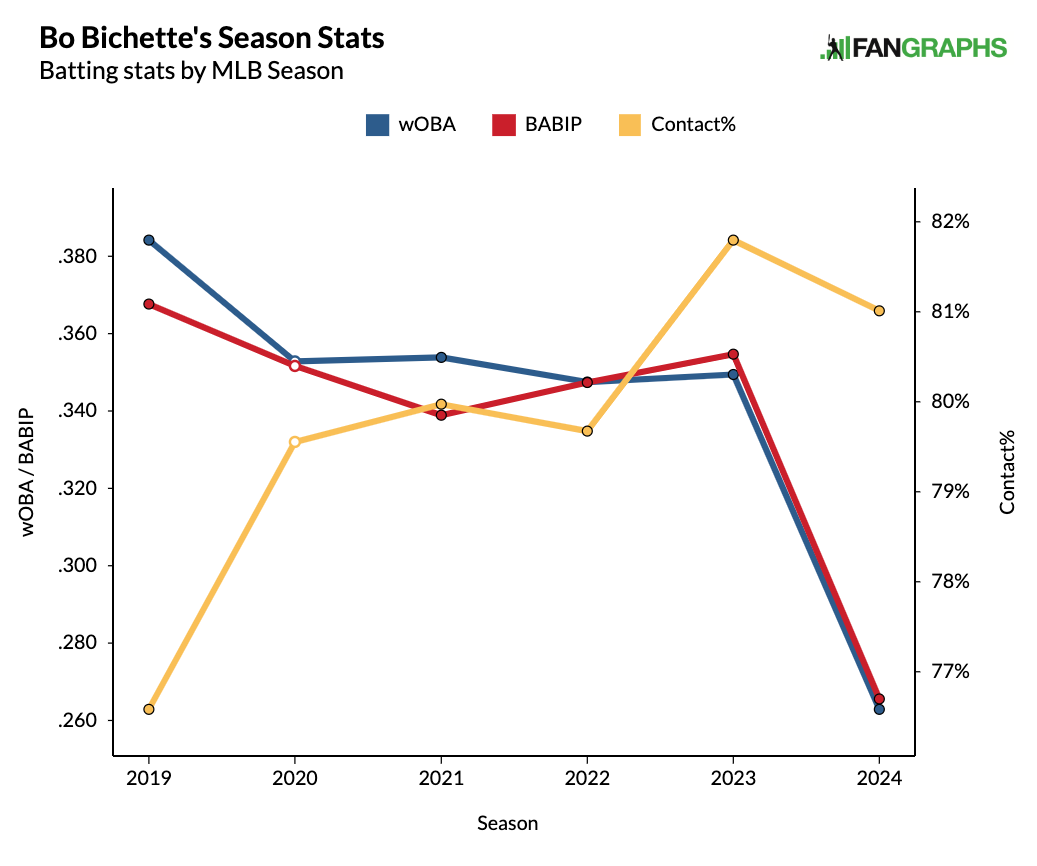
But I do think the Jays are finally starting to see positive regression. Vladdy is slashing .333/.346/.697 for a 1.043 OPS over the past month. George Springer has been MLB’s sixth-most valuable hitter during the stretch (205 wRC+, 1.6 fWAR). Sadly, Bichette still has a .240 BABIP during that time, but the whole lineup has a 109 wRC+.
Unfortunately, the question is if the Jays will sell heavily and start tanking. The rotation is vulnerable with Kevin Gausman’s splitter woes, and the bullpen is the worst in baseball (-1.6 fWAR), especially with their two best relievers shelved (Jordan Romano and Yimi Garcia).
The Braves won’t sell because they still hold a 2.5-game lead on the Cardinals for the NL’s top wild-card spot. FanGraphs and PECOTA project them with playoff odds over 80%.
They’ve been surprisingly great on the mound, racking up MLB’s second-most pitching fWAR (12.6).
They boast a top-10 bullpen by most metrics, which has been held down by the quartet of Joe Jimenez, Aaron Bummer, Raisel Iglesias and Pierce Johnson.
Chris Sale should be the outright favorite to win the NL Cy Young, and he’s worth a wager at any plus-money odds (+140, DraftKings). He leads the NL in pitching fWAR (3.7) and strikeout minus walk rate (27%), and his biggest competitors (Zack Wheeler and Paul Skenes) will have usage issues (Wheeler with a recent injury and Skenes being a rookie).
Sale's slider is again among the most dangerous pitches in baseball. Still, the key to his success has been moderating his fastball usage to righties, favoring offspeed stuff, especially a changeup. With the adjustments in approach, he's managed to even out the insane platoon splits he posted during his final few years on Boston — he's again a dominant pitcher against both sides.
Instead, the Braves have drastically underperformed in the lineup. They hold the largest negative differential of any team between slugging and expected slugging (.407 SLG, .442 xSLG) and the second-largest between wOBA and expected wOBA (.309 actual, .327 expected).
Among major hitters in the lineup, Adam Duvall, Michael Harris II, Austin Riley and Matt Olson have yet to catch a break.
| 2024 Braves Batter | PA | wOBA | Expected wOBA |
|---|---|---|---|
| Adam Duvall | 270 | .254 | .300 |
| Michael Harris II | 277 | .288 | .313 |
| Austin Riley | 359 | .344 | .367 |
| Matt Olson | 408 | .306 | .322 |
As a result, the Braves are MLB’s most profitable under team so far.
But that’s bound to change. The pitching staff is awesome, so the Braves could turn things around quickly once some more barrels find gaps.
Hitting is generally down across MLB this season. Unders are 723-710-61 this season across all games, which is a little higher than typical.
So, here are MLB’s top over teams this season.
| 2024 Team | Over Record | Profit (Units) | ROI (%) |
|---|---|---|---|
| Brewers | 54-40-5 | +10.5 | +10.6% |
| Tigers | 55-43-2 | +9.9 | +9.9% |
| Orioles | 50-39-10 | +7.4 | +7.5% |
| Mets | 52-43-3 | +6.0 | +6.1% |
| Giants | 52-44-4 | +5.0 | +5.0% |
But one fascinating split must be examined — Miami’s home overs:
| 2024 Marlins | Over Record | Profit (Units) | ROI (%) |
|---|---|---|---|
| Home | 35-17-1 | +15.9 | +29.9% |
| Away | 18-28-1 | -11.0 | -23.4% |
This makes no sense. loanDepot Park is a dome, thus among baseball's more stable run environments, ranking 15th in Savant’s three-year rolling Park Factors (exactly 100). Marlins home overs shouldn't generate a 30% ROI in any season.
Yet, the Fish boast a 4.81 ERA at home compared to a 4.21 ERA on the road. Given their hapless lineup (79 wRC+, 29th), the pitching staff must be the reason for their home/road over/under split.
Well, that’s not entirely true. The Fish have created runs at a 13% higher rate in South Beach (85 wRC+) than away from (72 wRC+) this season.
But I still blame the pitching staff – specifically, their poor home luck. The expected stats don’t align with how they have pitched in different parks.
| 2024 Marlins Pitchers | ERA | FIP | xFIP |
|---|---|---|---|
| Home | 4.81 | 3.82 | 4.00 |
| Away | 4.21 | 4.62 | 4.50 |
Then again, how are they supposed to survive with Ryan Weathers, Jesus Luzardo and Braxton Garrett on the IL – the former two are now on the 60-day.
The only real actionable part of this Miami analysis could be regarding the bullpen. In the preseason, I power-rated the bullpen as a borderline top-10 unit, but the unit pitched to a 4.66 ERA behind an 11% walk rate in April.
However, the Marlins 4.34 reliever xFIP indicated that was unsustainable. Since then, Miami's bullpen has led all relief corps in fWAR (4.0) while ranking second in win probability added (+4.9%).
Removing A.J. Puk from the rotation and putting him back into the bullpen has helped. But Tanner Scott (0.60 ERA, 2.94 xFIP, 33% strikeout, 1.0 fWAR) and Declan Cronin (4.32 ERA, 2.99 xFIP, 26% strikeout, 0.9 fWAR) have been the real saviors during the stretch. The former ranks third among relievers in fWRA since June started (0.7), and he’s working on a 13-outing scoreless streak, recording a whopping eight saves during that time. He's genuinely among the best relievers in baseball.
The Marlins have a borderline-elite bullpen, and their luck has come around. I expect more Marlins home unders in the future, especially when they run bullpen games with zero rotational depth.
- Check out more Daily MLB Odds here
It's always fun to see who the top home 'dogs are in any given season. In that regard, only two stick out.
The Motor City Kitties have generated a 31% ROI as home 'dogs across 18 tries. They've won three straight in that role (twice against the Dodgers, once against the Guardians).
When the Cubs are catching plus-money on a windy day at Wrigley, it's hard to avoid them. They are 4-3 as a home underdog when the wind is blowing anywhere but in, beating the Dodgers, Astros, Braves and Mets in those situations.
- Check out the full MLB ATS Standings here
Are you the type of baseball bettor to find certain pitchers and wager with — or against — them until you can't?
If you are, here are the most profitable starting pitchers on the ML so far this season:
| 2024 Starting Pitcher | ML Record | Profit (Units) | ROI (%) |
|---|---|---|---|
| Trevor Williams | 9-2 | +11.3 | +103.0% |
| Tanner Bibee | 15-5 | +7.8 | +38.9% |
| Mitch Keller | 13-6 | +7.8 | +41.0% |
| James Paxton | 14-4 | +7.2 | +40.1% |
| Shota Imanaga | 14-4 | +6.7 | +37.2% |
Don't keep riding with Washington's Trevor Williams.
He's overperforming thanks to some excellent home run luck, where his 3.% HR/FB rate is 10 points lower than his career 13% mark and 14 points lower than his 17% mark last season. As a result, Williams pairs a 2.22 ERA with a 3.28 ERA and 3.92 xFIP.
Hilariously enough, the Dodgers just DFA'd James Paxton.
On the flip side, here are the least profitable starting pitchers on the ML so far this year:
| 2024 Starting Pitcher | ML Record | Profit (Units) | ROI (%) |
|---|---|---|---|
| Chris Flexen | 2-17 | -12.9 | -68.0% |
| Yusei Kikuchi | 6-15 | -8.9 | -42.8% |
| Nestor Cortes | 7-14 | -8.6 | -41.1% |
| Aaron Civale | 6-14 | -8.0 | -39.9% |
| Dakota Hudson | 3-14 | -7.8 | -46.0% |
I'm surprised to see Yusei Kikuchi and Nestor Cortes among this group.
Kikuchi looks excellent, as he's seen an uptick in stuff marks (110 Stuff+) behind an increase in fastball velocity. Of course, the dreaded Blue Jays are holding him back.
As long as Cortes keeps his ERA under four (3.99 ERA, 3.66 xERA this year), the Yankees should win most of his starts. Alas, New York's lineup and bullpen are in free-fall, so they've lost seven of Cortes' last eight starting outings. That should change in the coming months as natural positive regression hits the soon-undervalued Yankees.


