


Teams aren’t hitting.
Joe Sheehan pointed it out in his latest MLB newsletter. On Tuesday, May 28, 102 total runs were scored across 15 games, fewer than seven per contest. May 2024 featured the third-lowest league OBP for any month since Richard Nixon was president.
| Month, Year | OBP |
|---|---|
| May, 1972 | .305 |
| April, 2022 | .307 |
| May, 2024 | .307 |
| September, 1972 | .308 |
Excluding extra-inning contests, games averaged 8.06 runs during the month. Again excluding extra innings, games are averaging 8.2 runs on the season, the lowest mark since 1978.
This has had a drastic effect on NRFI production. The combined NRFI record for all 30 MLB teams is 1013-824 – although there’s overlap, considering they all play each other. Still, the White Sox, Nationals and Giants have combined for a 127-59 NRFI record.
| Team | NRFI | YRFI |
|---|---|---|
| Nationals | 43 | 18 |
| White Sox | 43 | 19 |
| Giants | 41 | 22 |
| Orioles | 39 | 21 |
| Pirates | 39 | 22 |
| Blue Jays | 38 | 23 |
| Royals | 38 | 24 |
| Cubs | 37 | 25 |
| Mets | 37 | 25 |
| Angels | 36 | 26 |
| Guardians | 36 | 25 |
| Diamondbacks | 35 | 27 |
| Brewers | 34 | 28 |
| Marlins | 34 | 28 |
| Phillies | 34 | 29 |
| Rangers | 34 | 28 |
| Red Sox | 34 | 28 |
| Reds | 33 | 29 |
| Cardinals | 32 | 28 |
| Tigers | 32 | 20 |
| Braves | 31 | 28 |
| Dodgers | 31 | 32 |
| Rays | 31 | 31 |
| Yankees | 31 | 32 |
| Athletics | 30 | 33 |
| Astros | 29 | 34 |
| Padres | 27 | 38 |
| Twins | 27 | 34 |
| Mariners | 25 | 28 |
| Rockies | 22 | 39 |
| Combined | 1013 | 824 |
The Blue Jays recently had 27 straight NRFIs hit, which seems legitimately impossible, especially since the first inning is historically the highest scoring frame.
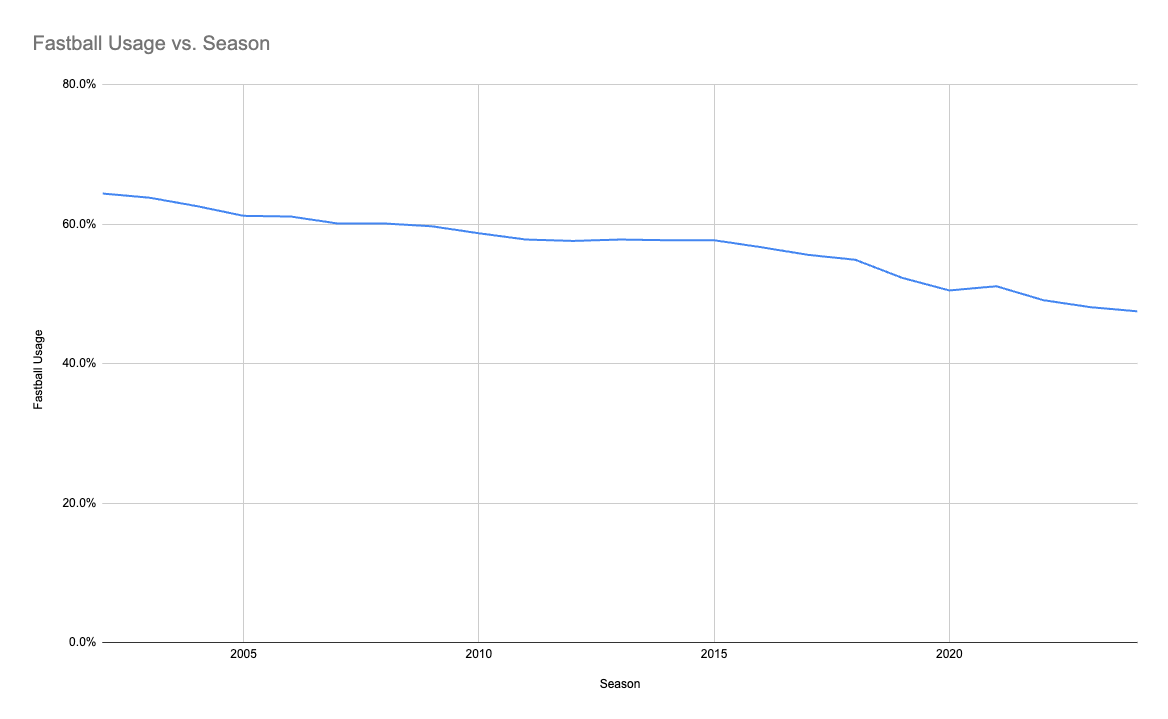
I was curious to see if this is a result of fewer fastballs being thrown.
FanGraphs has been tracking pitch usage since 2002, and this season represents the lowest league-wide fastball usage rate yet, building upon a consistent downhill trend.
| Season | Fastball Usage |
|---|---|
| 2024 | 47.5% |
| 2023 | 48.1% |
| 2022 | 49.1% |
| 2021 | 51.1% |
| 2020 | 50.5% |
| 2019 | 52.3% |
| 2018 | 54.9% |
| 2017 | 55.6% |
| 2016 | 56.7% |
| 2015 | 57.7% |
| 2014 | 57.7% |
| 2013 | 57.8% |
| 2012 | 57.6% |
| 2011 | 57.8% |
| 2010 | 58.7% |
| 2009 | 59.7% |
| 2008 | 60.1% |
| 2007 | 60.1% |
| 2006 | 61.1% |
| 2005 | 61.2% |
| 2004 | 62.6% |
| 2003 | 63.8% |
| 2002 | 64.4% |
I recently wrote a piece for Pitcher List on Boston’s new and unique pitch mix. The Red Sox have significantly limited their heater usage because secondary offerings force more whiffs and induce more weak contact. New pitching coaches Andrew Bailey and Justin Willard are smart folk.
So far through 2024 — a 16,000-pitch sample size — secondary offerings continue to outperform fastballs.
| Pitch Type | League SLG | League wOBA | League Strikeout Rate |
|---|---|---|---|
| Fastballs | 0.416 | 0.335 | 18.7% |
| Breaking | 0.358 | 0.277 | 28.5% |
| Offspeed | 0.348 | 0.269 | 23.8% |
The A’s have subscribed to a similar philosophy. Oakland ranked fourth in fastball usage last season (52%) but has dipped to 26th this year (43%). The result has been a drastically improved run-prevention unit, headlined by the overwhelmingly dominant Mason Miller in the bullpen.
I wouldn’t be surprised if Boston and Oakland are revolutionizing how pitching staffs attack the art of pitching. Throwing fewer fastballs could be a Moneyball-like change in the sport. Weird how baseball works sometimes.
Then again, expected metrics are trending above actual ones across the league, so I would be surprised if this is nothing more than a month-long, variance-driven blip on the scoring radar. Then again, Statcast is basing its expected results on the past few seasons, and this year’s results aren’t aligning with past batted-ball production.
As Sheehan writes:
“Statcast is expecting an extra 50 points of average, an extra 80 points of slugging and wOBA on these balls. Those expectations have been dashed. Directionally, it’s a mess. In each of the last three years, the actual outcomes on barrels have been better than the expected ones, sometimes by as much as 40 points of wOBA. This year, obviously, the reverse is the case. For whatever it’s worth, the rate of barrels is constant, 1.3-1.4% of batted balls, over the four-year period. Players are hitting the ball on the screws as much as they ever have, just getting much less for their hard contact.”
The data is fuzzy – and ultimately worth a second look in a separate column – but I wanted to take this opportunity to discuss a ballpark and team that’s scoring more despite the decrease in overall offensive production.
Because Guardians Overs are in play.

Progressive Field Renovations
I went on Payoff Pitch last week and discussed Cleveland’s drastic increase in Park Factors.
At the time, I didn’t know the direct cause of the increase, but a loyal listener informed me of offseason changes to Progressive Field.
In retrospect, I should’ve known about these changes, given that I read Baseball Prospectus’ preseason book every year. As written by Scott Hines:
“Progressive Field began undergoing a fresh round of renovations over the offseason, a series of changes that will stretch into the 2025 season. … The whole structure of the upper deck is being cut back, creating a much more permanent-seeming setting for open viewing terraces which will offer wide-open vistas of Cleveland from inside the ballpark.”
They’ve also removed the shipping containers from the outfield stands, which originally “served as standing-room terraces available for rent to corporate groups and parties.”
I never put two and two together, but it all makes sense. We should’ve seen it coming.
Obviously, Progressive has seen a monster boost in Park Factors year over year. Getting rid of bleachers and shipping containers allows more wind to blow through the park, potentially creating a wind tunnel that’s carrying fly balls far too far.
| Progressive Field Season | Park Factor (MLB Rank) | HR Factor (MLB Rank) | Double Factor (MLB Rank) |
|---|---|---|---|
| 2024 | 103 (9th) | 122 (4th) | 125 (2nd) |
| 2023 | 94 (28th) | 67 (30th) | 110 (6th) |
| 2022 | 96 (26th) | 87 (23rd) | 93 (27th) |
| 2021 | 100 (14th) | 110 (9th) | 102 (11tth) |
It’s been a monster development for the Guardians because they’re a contact-based, pesky lineup rather than a hard-hitting one. Since the start of 2021, the Guardians pair the second-lowest strikeout rate (20%) with the lowest hard-contact rate (28%) among MLB lineups. José Ramírez is the metronomic power presence in the middle of the order, but much of their production comes from Steven Kwan and other such bat-to-the-ball slapshooters.
But the Guardians are pulling more fly balls this season (42%, sixth in MLB), especially at home (40% fly-ball rate, ninth among MLB teams at home). And if you can make elevated, pulling contact at even moderate exit velocities, you can produce dramatic results in Cleveland.
For example, I read an article on this phenomenon from Tony Blengino at Forbes, and I had to repeat this stat:
“In all of MLB through 5/19, 9.4% of 95-100 mph fly balls were home runs. In Cleveland, an amazing 22.6% of such fly balls left the yard, far and away the highest rate in the game.”
The data is a bit dated now, but it’s still remarkable to read out loud.
For a specific example, check out this Ramírez homer off Bailey Ober on May 18.
This batted ball had a 93 mph exit velocity paired with a 25-degree average launch angle but ended up flying 346 feet over the right-field wall. Across the prior three years at Progressive Field, only two other balls have been hit with this combination of exit velocity and launch angle:
This 320-foot right-field flyout by Gary Sánchez.
And this 331-foot center-field flyout by Bobby Witt Jr.
For another specific example, here are the top seven home-run leaders so far this season, with their relevant batted-ball statistics.
| Player | Home Runs | Avg. EV (mph) | Barrel Rate (%) |
|---|---|---|---|
| Aaron Judge | 24 | 97.1 | 29.2 |
| Gunnar Henderson | 20 | 94.1 | 13.4 |
| Kyle Tucker | 19 | 91.0 | 13.8 |
| Marcell Ozuna | 18 | 93.4 | 18.6 |
| Jose Ramirez | 18 | 89.5 | 9.0 |
| Juan Soto | 17 | 95.5 | 20.0 |
| Teoscar Hernandez | 16 | 91.9 | 16.0 |
| Josh Naylor | 16 | 91.5 | 11.3 |
It makes sense that Kyle Tucker would be on this list with "relatively" low average exit velocities, given he gets an added boost from Minute Maid Park's shorter porches; Minute Maid has the second-highest Home Run factor of any park this season (133).
Similarly, Ramírez and Josh Naylor aren't hitting the ball as hard as other top power hitters, but they're elevating enough (Ramírez 19-degree average launch angle, Naylor 13-degree) and letting Progressive Field do the rest.
The ball is carrying an extra 15-to-25 feet this season, and it's showing up in the numbers. The split between Cleveland’s batted-ball profile and actual production makes sense now.
| 2024 Stat | Mark | MLB Rank |
|---|---|---|
| fWAR | 10.0 | 10th |
| wRC+ | 107 | 8th |
| wOBA | 0.315 | 10th |
| SLG | 0.400 | 10th |
| OPS | 0.718 | 10th |
| ISO | 0.160 | 8th |
| Hard-Hit Rate | 35.2% | 30th |
| Barrel Rate | 6.5% | 28th |
| Avg. Exit Velocity | 88.2 | 26th |
The Guardians have never had a hard-hitting lineup, but they don’t have to be anymore. They can be a contact-based lineup and still produce power numbers. They rank 19th among MLB lineups in hard-contact rate (30%), but ninth in homers (72) and 11th in doubles (106).
It also makes sense that the Guardians are 42-22 overall, including 21-8 at home, and hold a five-game lead in the suddenly hyper-competitive AL Central – the Royals, Twins and Tigers are good now.
Of more importance to us gamblers, Cleveland home Overs are a thing now. With the decline in scoring across MLB and the Guardians’ offensive production at home over the past few seasons, the market seems to be underprojecting Progressive Field’s run-scoring prowess.
Only the Marlins, Brewers and Dodgers have produced a higher ROI on home-park Overs this year.
I wouldn’t be surprised if this trend continues, especially with Cleveland’s rotation. The Guardians rank last among MLB teams in starting pitching fWAR (1.9), tied directly to their second-highest HR/FB rate allowed (13%). They aren't just hitting more homers at home, they're also allowing more.
Obviously, the change in park factors is inflating those numbers, but the guys in the rotation – especially Triston McKenzie, Carlos Carrasco and Logan Allen – have historically had home run problems.
| Pitcher | Career HR/FB | Career HR/9 |
|---|---|---|
| Tanner Bibee | 8.8% | 0.91 |
| Ben Lively | 13.2% | 1.56 |
| Carlos Carrasco | 14.7% | 1.13 |
| Logan Allen | 13.8% | 1.37 |
| Triston McKenzie | 12.6% | 1.42 |
Since the start of 2021, Cleveland starting pitchers have forced the sixth-lowest ground-ball rate among MLB rotations (40%). While that used to be sustainable, it won’t fly in Cleveland anymore – or, should I say, it will fly?
Even though the Guardians boast MLB's best bullpen, I still think we’ll see more high-scoring games in Cleveland. Keep an eye on those Overs until the market adjusts and starts pricing Progressive Field closer to Coors Field or Great American Ball Park.


