Diamondbacks vs. Giants Odds
| Diamondbacks Odds | -114 [Bet Now] |
| Giants Odds | +100 [Bet Now] |
| Over/Under | 9.5 (-105/-115) [Bet Now] |
| First Pitch | 9:45 p.m. ET |
Odds as of Friday at 3 p.m. ET and via DraftKings. Get up to a $1,000 sign-up bonus at DraftKings today or see more offers and reviews for the best online sportsbooks.
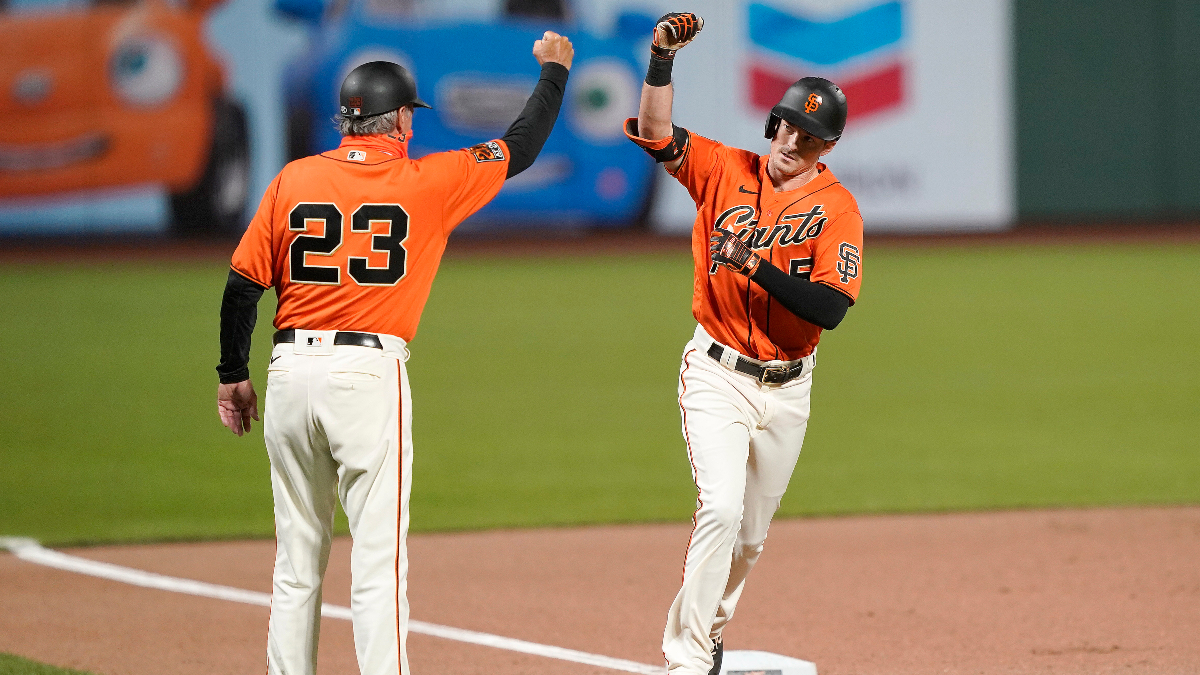
The San Francisco Giants welcome in the Arizona Diamondbacks for a three-game series at Oracle Park. The Diamondbacks are on a two-game skid, while the Giants will be looking for their first four-game win streak of the season.
The Giants erupted for 10 runs against the Los Angeles Angels and rank seventh in MLB with 132 runs scored, while the Diamondbacks rank 14th with 121. Defensively, Giants are tied at the bottom of the league with the Red Sox for most runs allowed (160), while the Dbacks are tied for fifth-worst with 132. This combination of offensive output mixed with subpar pitching could lead to a barrage of runs scored in this series.
Let’s do a deep dive to see how both teams measure up and what we can expect from them when they meet.
Advanced Stats Glossary
FIP or Fielding Independent Pitching measures what a pitcher’s ERA would look like if the pitcher experienced league-average defense and luck. xFIP is a regressed version of FIP that adjusts or “normalizes’ the home run component based on park factors.
wRC+ or Weighted Runs Created Plus takes the statistic Runs Created and adjusts that number to account for critical external factors — like ballpark or era. It’s adjusted, so a wRC+ of 100 is league average, and 150 would be 50 percent above league average.
wOBA or Weighted On-Base Average is a catch-all hitting metric with more predictive value than on-base percentage. An average MLB hitter can be expected to post a .320 wOBA. xwOBA is a regressed version of wOBA that accounts for variables like park factors.
BaseRuns is a formula designed to estimate how many runs a team would be expected to score (or allow) given their underlying offensive (or defensive) performance. In other words, BaseRuns is a context-neutral run estimator used to evaluate teams. Major League average for an individual batter per game is 0.50 BaseRuns and a for a pitcher its 0.52 BaseRuns per inning.
San Francisco Giants
The Giants have racked up 234 hits this season, which is good enough for second in the majors, but a better stat that measures their success at scoring runs is their wRC+. According to Fangraphs, the Giants have six players who are above average in wRC+. They are also in the top half of the league with a .293 BABIP and sixth in the league with strikeout rate of 21%.
These are good metrics for a team on offense because having less strikeouts allows the Giants team to be even more effective given they are above league-average on balls they’re able to put in to play.
The Giants' pitching staff has a 5.45 ERA with a 5.28 FIP. The difference of .17 runs in the higher ERA when compared to their FIP suggests that they have probably been marginally unlucky at best with the runs they’ve allowed.
As far as strikeouts are concerned, the Giants are third from last in the league with 8.04 punch outs per nine innings. This low strikeout rate is a problem considering that that opposing teams have a .283 BABIP against them. Fewer strikeouts mean more opportunities for teams to continue to have success against them with balls put in play.
Arizona Diamondbacks
The Diamondbacks rank eighth in the majors with 221 hits and they’ve been able to make the most of their opportunities when they’ve put the ball in to play with a .301 BABIP — good for eighth in the league in this category.
Perhaps what’s even more impressive is that the Dbakcs have the second-lowest strikeout percentage (20.2%), which allows for more success when they make contact given their BABIP average that sits above .300.
However, a more complete assessment of the Diamondbacks' ability to create runs (wRC+) shows they’re actually below the average of with a rating of 93. This rating discounts some of Arizona’s production due to the fact that they plain in hitter-friendly ballparks.
The Dbacks' overall performance for the year suggests they should have actually performed better with all things being equal. While some hits may have fallen in for the Diamondbacks, they’re not doing a good enough job converting their opportunities into runs.
Part of that is due to a power outage at the plate. Arizona ranks in the bottom-five of the league with 22 home runs and in the bottom-eight in terms of slugging with a .390 percentage.
One can conclude that the Diamondbacks have to work harder to score runs, particularly in ballparks that are not as hitter friendly.
Arizona’s pitching staff has a 5.16 ERA with a 5.48 FIP. With a FIP that's higher than the ERA by 0.32 runs, Arizona’s earned run average could be in line for some regression in the future.
That should worry Arizona considering they already have the eighth-worst ERA in the majors. This team’s biggest flaw is the home run ball and they lead the league with 2.04 home runs allowed per nine innings.
In total, the Diamondbacks have allowed 29 more home runs than they’ve hit themselves. You can be sure the Giants won't be offering them any sympathy as they look to improve on their current tally of 34 home runs.
Diamondbacks-Giants Betting Pick
I bet the Giants yesterday to go over their team total of 4.5 runs. I thought it was a bad number sent out by the bookmakers and it seems they've yet to learn their lesson. My guess is they're still using last year's metrics to grade the Giants, but this is a team that is currently 9-1 to the over at home.
It's not often you catch the bookmakers asleep at the wheel, but when you do, you must strike with the force of 100 Lilliputian men.
DraftKings is still offering a total of of nine for the over/under in this game. This total is way short and I expect it to sail over the current number. Take the over tonight in what could be a powder keg explosion of runs scored.
The Pick: Over 9.5 (Play up to 9.5)


