- Tuesday's MLB slate features 16 games and plenty of betting value.
- Sean Zerillo, our resident MLB expert, breaks down his projections for each game and explains where the betting value lies for Tuesday's action.
- Check out all of his top bets for Tuesday's MLB slate below.
Tuesday features a 16-game MLB slate. You can find my projections for every MLB game in the Action Network App (on both the PRO Projections tab and the game pages) and our Projections Hub (which you can bookmark).
As I mentioned in my last Tuesday column, bookmakers continue to make totals lower and lower as the season progresses, but we may have finally hit bottom.
While unders have dominated the year — hitting at a 56% clip — overs are finally having a moment in May as the totals have dropped, sitting 65-56-5 on the month.
The average total from April 7-17 was 8.79 but dropped to roughly 7.85 for the second half of April. For Monday's 11-game slate, the average total was 7.36. The average total of the 13 games currently showing odds for Tuesday is 7.42.
In games where the total settled at 6.5, the over is 14-8; the final score landed on exactly seven on five occasions.
Using my projections, where can we find actionable value on Tuesday?
Odds tables via Caesars. You can shop for the best MLB lines all season long via our MLB odds page.
Boston Red Sox vs. Atlanta Braves
Garrett Whitlock vs. Kyle Wright
| Red Sox Odds | +115 |
| Braves Odds | -135 |
| Over/Under | 7.5 (-115/-105) |
| First Pitch | 7:20 p.m. ET |
Model Projection (full projections here)
- Red Sox probability: 43.5% (fair odds of +130)
- Braves probability: 56.5% (-130)
- Projected total: 7.10
Kyle Wright, the No. 5 overall pick in 2017, has proven to be one of 2022's best breakout stories.
The righty shows improved velocity (up from 93.7 mph to 95.4 mph, year over year) and command (5.8% BB%; 12.4% career), alongside a new pitch mix:
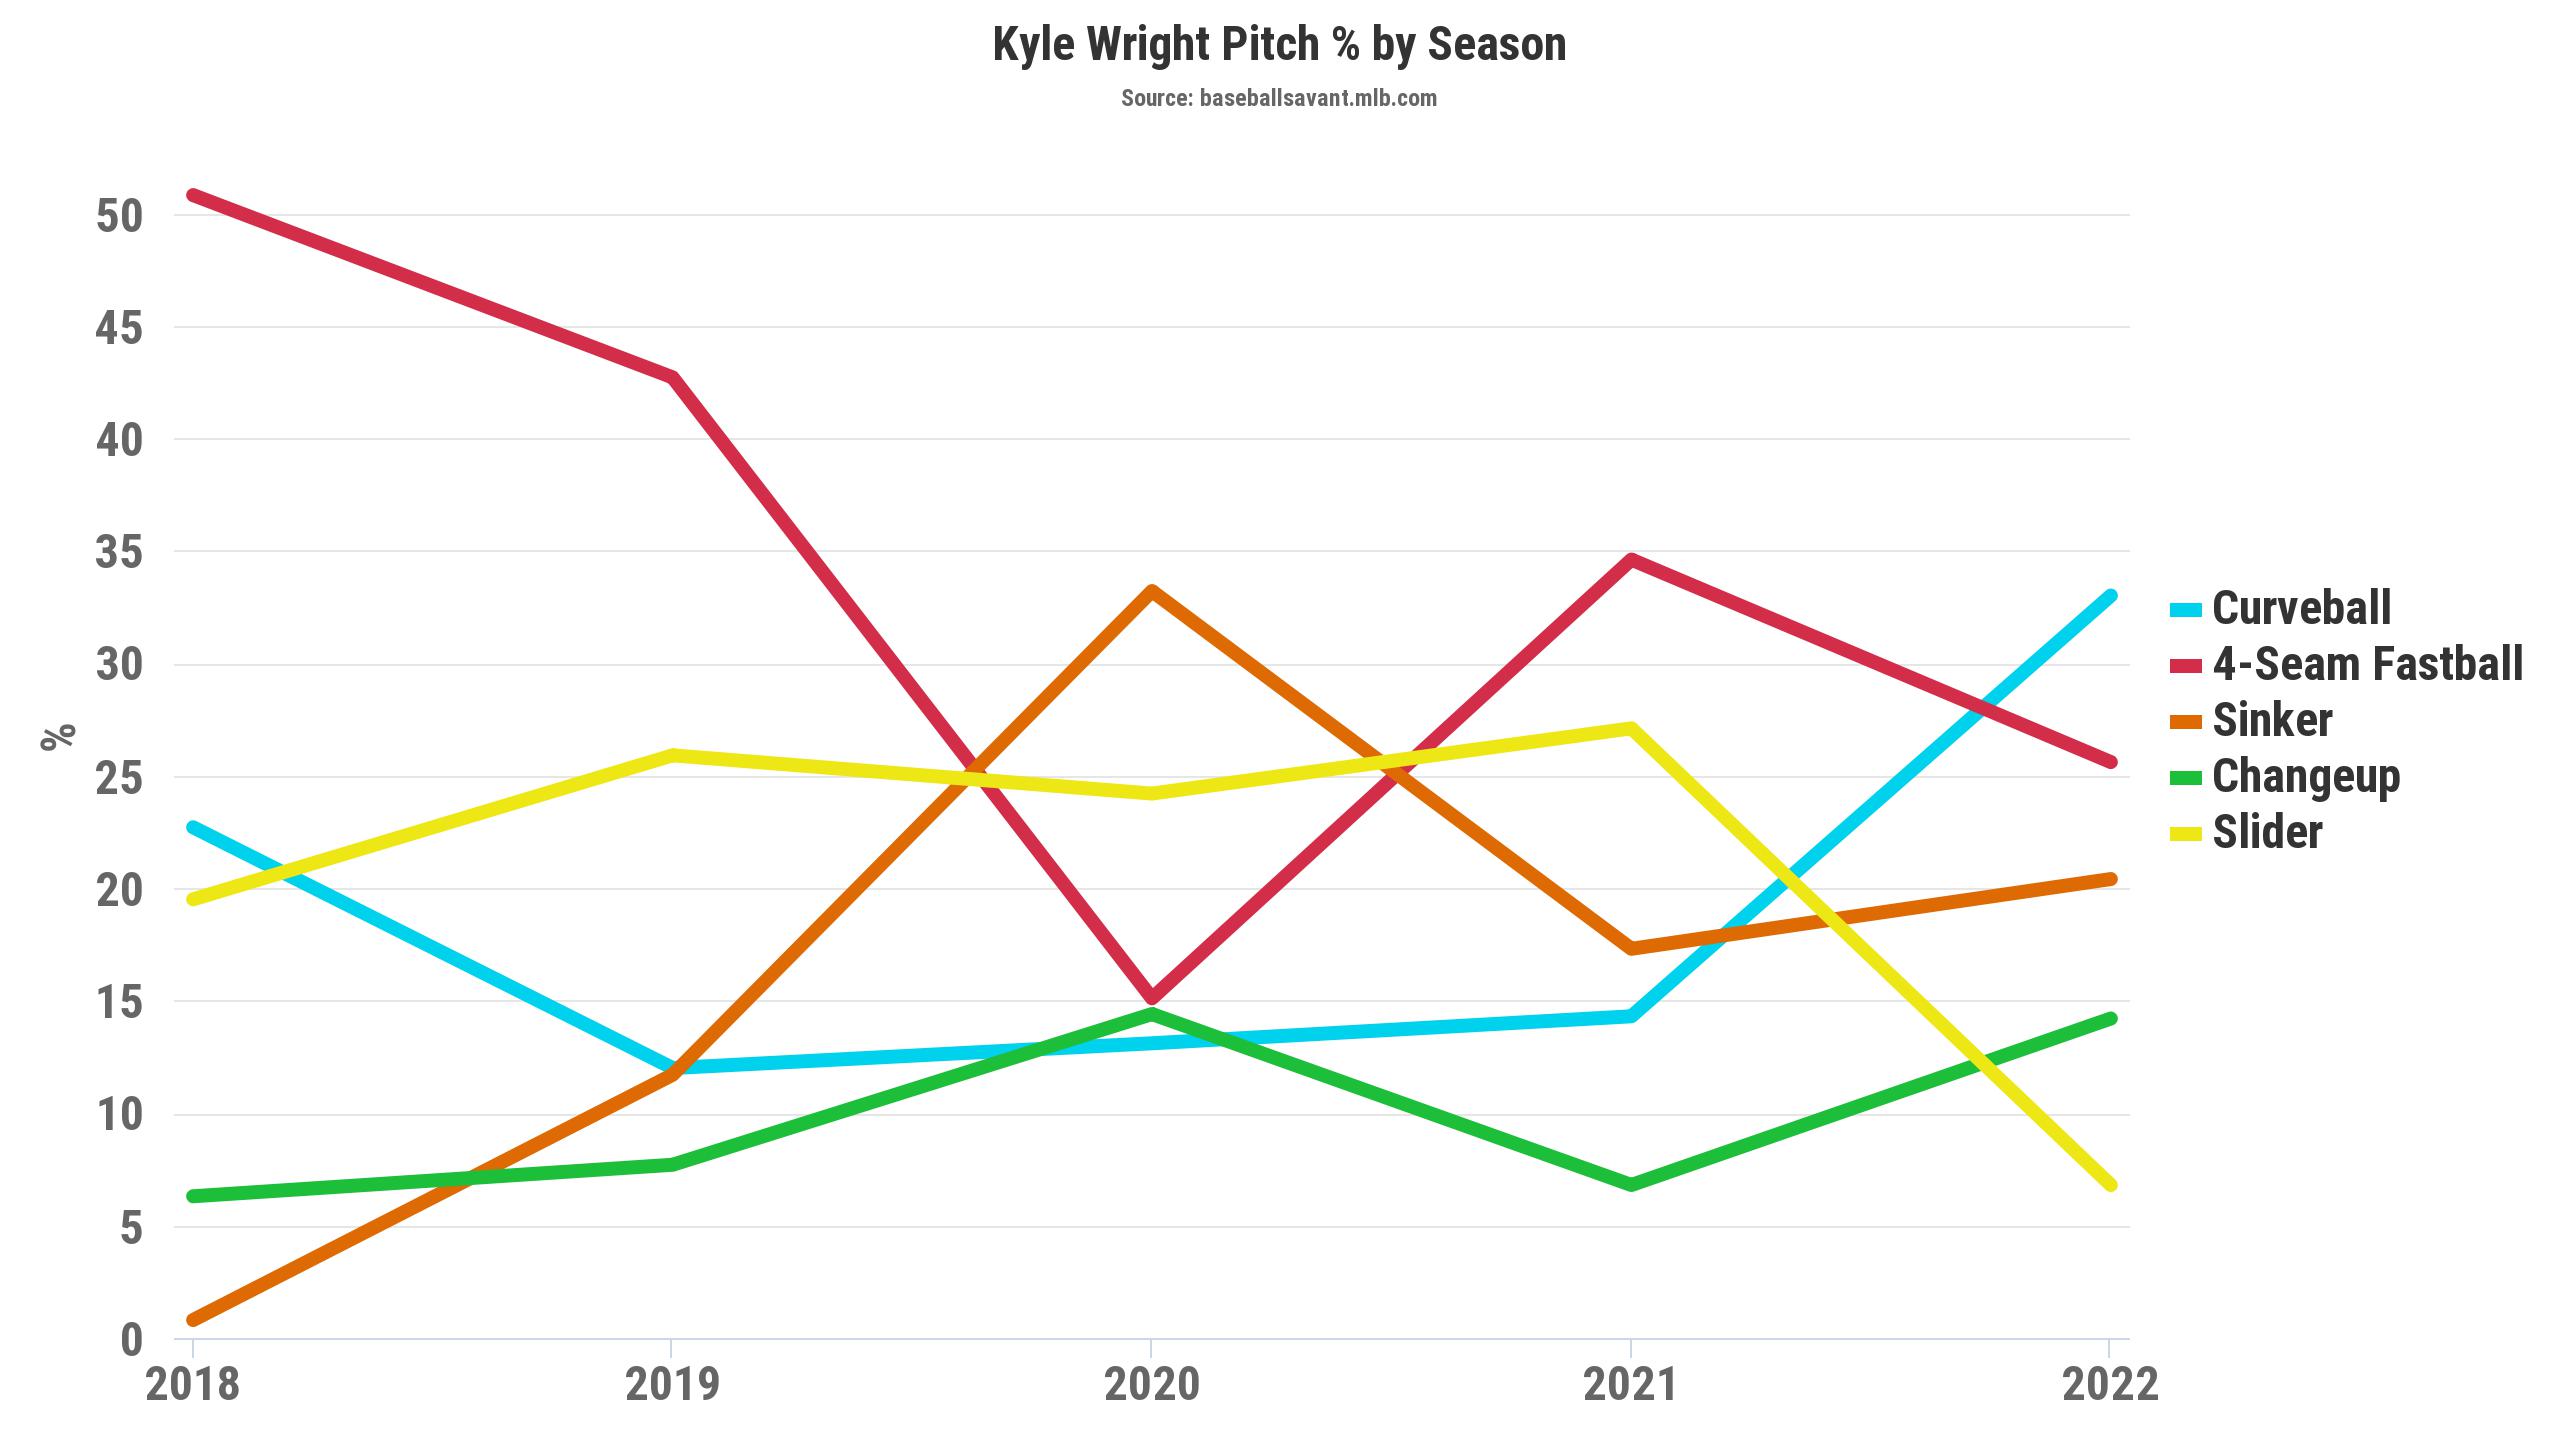
Wright has mostly scrapped his slider (down from 27.1% in 2021 to 6.8% this season) while reinvesting in both his curveball (14.3% to 33%) and changeup (7.5% to 14%).
Moreover, Wright has made a concerted effort to locate his fastball at or above the top of the strike zone — a noticeable change from prior seasons:
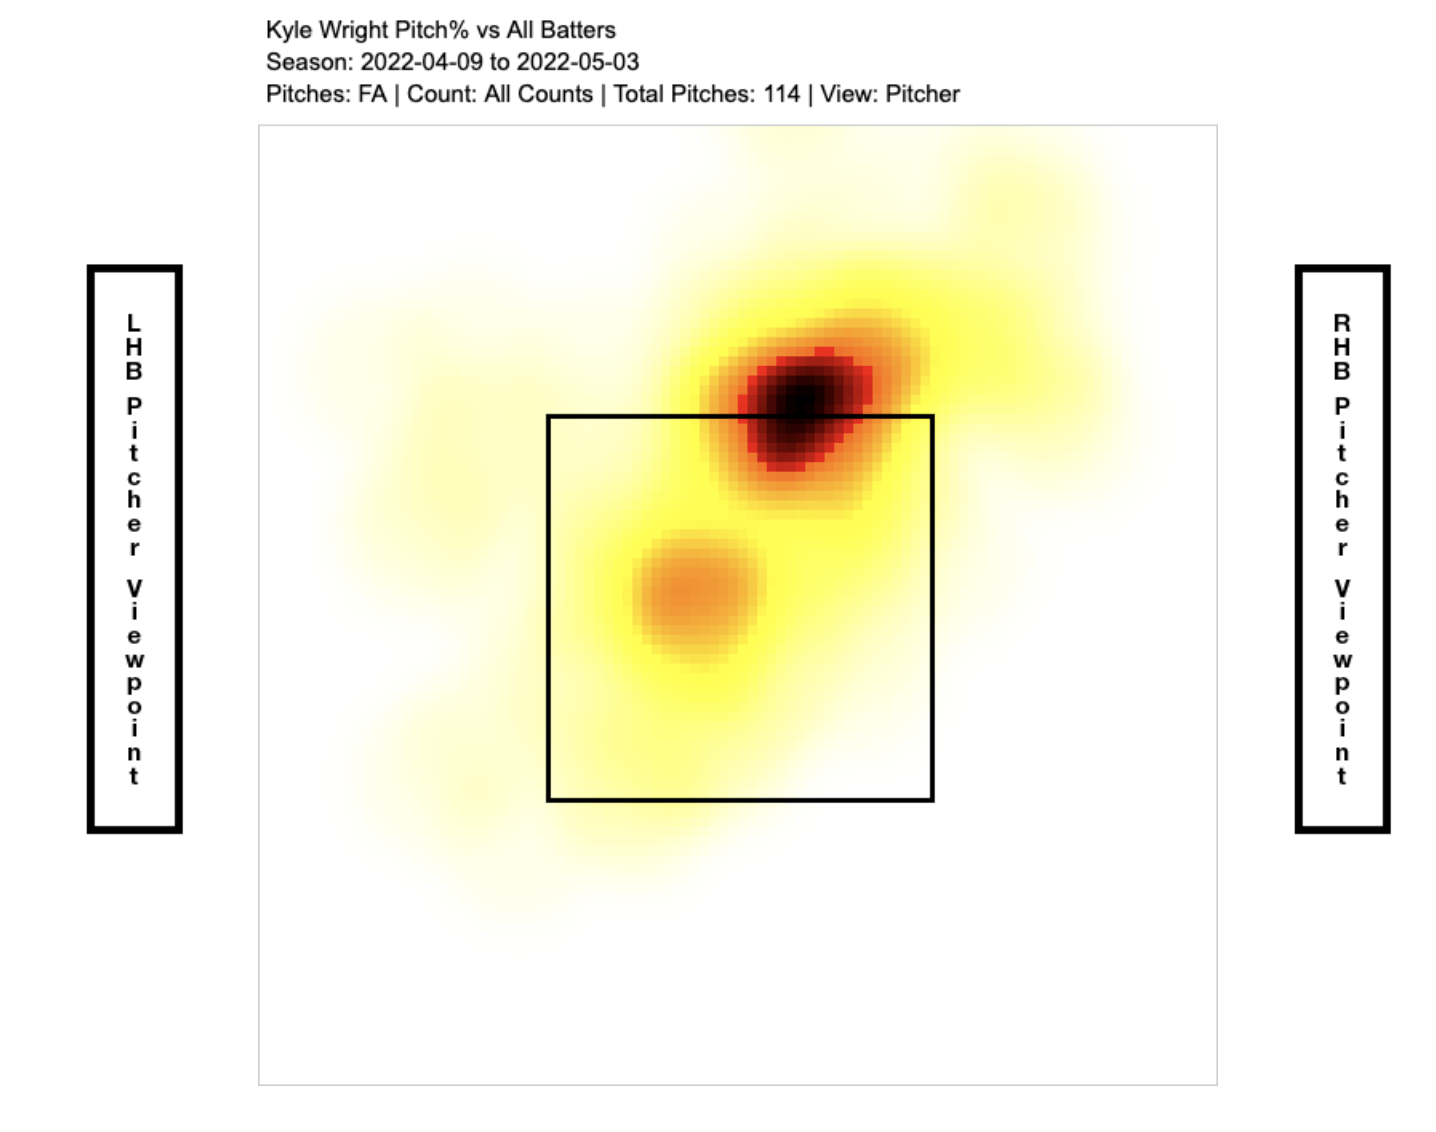
Through five starts, the results are a 2.51 xERA, 2.59 xFIP and a 2.47 SIERA, making Wright one of the best starters in baseball with both his fastball (.161 xBA) and curveball (.190 xBA) dominating the opposition.
Garrett Whitlock (1.83 xERA, 2.10 xFIP, 1.87 SIERA) has been similarly dominant for the Red Sox, albeit spread across seven appearances between the bullpen and rotation.
Whitlock, a former Rule 5 selection, was a highly-effective reliever last season (2.94 xERA), and Boston has done well to stretch him out to five innings in his most recent outing.
His pitch mix is more simplistic (sinker/changeup/slider), but Whitlock can use his slider against righties (28.6% usage) and his changeup against lefties (33.6% usage) alongside the sinker, to get all types of hitters out.
He's also throwing with a ton of confidence now that the transition to the rotation has been proven successful:
Garrett Whitlock, Blowing away the Side. ⛽️ pic.twitter.com/Luex9GuYGt
— Rob Friedman (@PitchingNinja) May 4, 2022
Quietly, Wright and Whitlock have emerged as the best pitchers on their respective teams.
While I don't show value on either side of the moneyline (I need -120 to play Atlanta), I projected the F5 total at 3.43 and the full game total at 7.1. Bet the unders to 4 (-130) and 7.5 (-105), respectively.
Recommended Bets
- Red Sox/Braves, F5 Under 4 (-115) at BetMGM (bet to -130)
- Red Sox/Braves, Under 7.5 (+100) at WynnBET (bet to -105)
Houston Astros vs. Minnesota Twins
Justin Verlander vs. Joe Ryan
| Astros Odds | -140 |
| Twins Odds | +120 |
| Over/Under | 6.5 (-125/+105) |
| First Pitch | 7:40 p.m. ET |
Model Projection (full projections here)
- Astros probability: 52.9% (fair odds of -112)
- Twins probability: 47.1% (+112)
- Projected total: 6.95
Nobody knew how Justin Verlander would look this season, coming off of Tommy John surgery at age 39. Still, the future Hall-of-Famer has posted a dominant line (1.93 ERA, 0.70 WHIP) to date while showing velocity and command in line with pre-injury levels.
However, Verlander isn't generating whiffs (9.7%) nearly as often as he once did (16% in 2019). His contact rate (82.1%) stands at its highest mark since 2014 (81.4%), and both his BABIP (.192) and strand rate (92.4%) should regress to a significant degree (career .280 BABIP and 75.3% strand rate).
Verlander's ERA should eventually move toward his expected indicators (2.91 xERA, 3.12 xFIP, 2.91 SIERA). While he's still an elite starting pitcher, I'm not confident that he'll be Cy Young-worthy at year's end.
Joe Ryan also has room to regress based upon his .212 BABIP and 90.4% strand rate. Like Verlander, Ryan's ERA (1.63) is substantially better than his indicators (2.96 xERA, 3.70 xFIP, 3.25 SIERA).
I have a +4000 AL Rookie of the Year ticket on Ryan. I loved him coming into this season, but my one concern was the long ball (1.35 HR/9 in 2021). Still, in the current run-scoring environment, fewer home runs benefit Ryan more than it would most pitchers.
He's also traded some fastballs for sliders (+13% usage), bringing his fastball usage from over 60% to 52.2% — more closely aligned with the league average (48.5%). Ryan is closer to Verlander than most may realize in terms of overall effectiveness.
Joe Ryan, Nasty 82mph Slider…and Sword. ⚔️ pic.twitter.com/rD76cQ6pa0
— Rob Friedman (@PitchingNinja) May 4, 2022
I placed this bet assuming that Byron Buxton (day-to-day with a hip strain) will play on Tuesday. If Buxton is out of the lineup, I will set the Twins closer to current odds.
If Buxton is in the lineup, you can play the Twins at +121 or better; but I'm happy to speculate before the news drops with a moderate wager.
Recommended Bets
- Minnesota Twins (+125) at DraftKings (bet to +121)
Kansas City Royals vs. Texas Rangers
Brad Keller vs. Martin Perez
| Royals Odds | +115 |
| Rangers Odds | -135 |
| Over/Under | 8 (+100/-120) |
| First Pitch | 8:05 p.m. ET |
Model Projection (full projections here)
- Royals probability: 47.7% (fair odds of +110)
- Rangers probability: 52.3% (-110)
- Projected total: 7.67
Pitch-to-contact types are excelling in the current run-scoring environment, and no matchup on Tuesday exudes that more than Brad Keller (1.74 ERA, 3.02 xERA, 3.81 xFIP) vs. Martin Perez (2.25 ERA, 2.71 xERA, 3.95 xFIP).
Both pitchers have outperformed their most optimistic preseason projection, and neither performance seems sustainable.
Since moving to Texas, Perez is throwing fewer cutters (-11% usage) in exchange for more fastballs and curveballs, which has helped earn more called strikes (up to a career-high of 19.4%). Still, his swinging strike rate (8.5%) remains aligned with his past two seasons. I'm convinced that he'll eventually regress towards preseason projections (FIP range of 4.47 to 4.68) by year's end once he starts allowing some home runs.
Keller has an unsustainably low BABIP (.186) and high strand rate (82%), which should revert toward career benchmarks (.292 and 73.1%, respectively. He hasn't modified his pitch mix, and like Perez, there's no growth in his ability to miss bats.
Still, Keller projected as a slightly better pitcher than Perez coming into the season (FIP range 4.28 to 4.48). And given their respective styles, defense plays a massive factor in determining their outcomes.
While I project the Royals as a top-10 defensive team, they haven't performed like one to date per Defensive Runs Saved or "DRS" (22nd), though Outs Above Average or "OAA" (6th) is much more encouraging.
CATCH OF THE YEAR???
Michael Taylor took this HR away 😱pic.twitter.com/wBWwFW6lq6
— Caesars Sportsbook (@CaesarsSports) May 2, 2022
Conversely, I project the Rangers as a below-average defensive unit, and both metrics (18th in DRS, 22nd in OAA) align with that assumption.
Ultimately, the quarter-run projection discrepancy between the pitchers, alongside approximately a 2% defensive edge for Kansas City, provides value on the road team here.
I projected the Royals around +110 in either half and would bet their F5 line at +120 or better and their full game line at +118.
I set my edge filter at 2% to place a bet, and the defensive difference is enough to force my hand in this head-to-head.
Recommended Bets
- Kansas City Royals F5 (+120) at DraftKings (bet to +120)
- Kansas City Royals (+120) at Wynn (bet to +118)
Philadelphia Phillies vs. Seattle Mariners
Aaron Nola vs. Robbie Ray
| Phillies Odds | -125 |
| Mariners Odds | +105 |
| Over/Under | 7 (-110/-110) |
| First Pitch | 9:40 p.m. ET |
Model Projection (full projections here)
- Phillies probability: 54.8% (fair odds of -121)
- Mariners probability: 45.2% (+121)
- Projected total: 6.88
Aaron Nola underperformed relative to his expected indicators last season (4.63 ERA, 3.35 xERA, 3.37 xFIP), and he's doing it again this year, (3.38 ERA, 2.61 xERA, 2.55 xFIP) sitting with a 1-3 record through six starts despite a trio of consecutive quality starts.
Nola pounds the zone (league-leading 72.7% first-pitch strike rate and 19.6% called-strike rate, 6th). This season, he introduced a cutter to his arsenal (6.9% usage) to add a fifth look for opposing hitters.
And he's a true workhorse, leading MLB in innings pitched (701 1/3) since the 2020 season. There's nothing to dislike in his profile — aside from the lack of offensive run support — but he's as due for positive regression as any frontline pitcher.
Speaking of regression, Robbie Ray (4.38 ERA, 3.75 xERA, 4.13 xFIP, 4.12 SIERA) has fallen back toward his career marks on the heels of his Cy Young campaign and after signing a five-year, $115 million contract.
His stuff has reverted after reaching a career-high in velocity (94.8 mph) last season. On average, his fastball velocity is down 2.2 mph relative to last year:
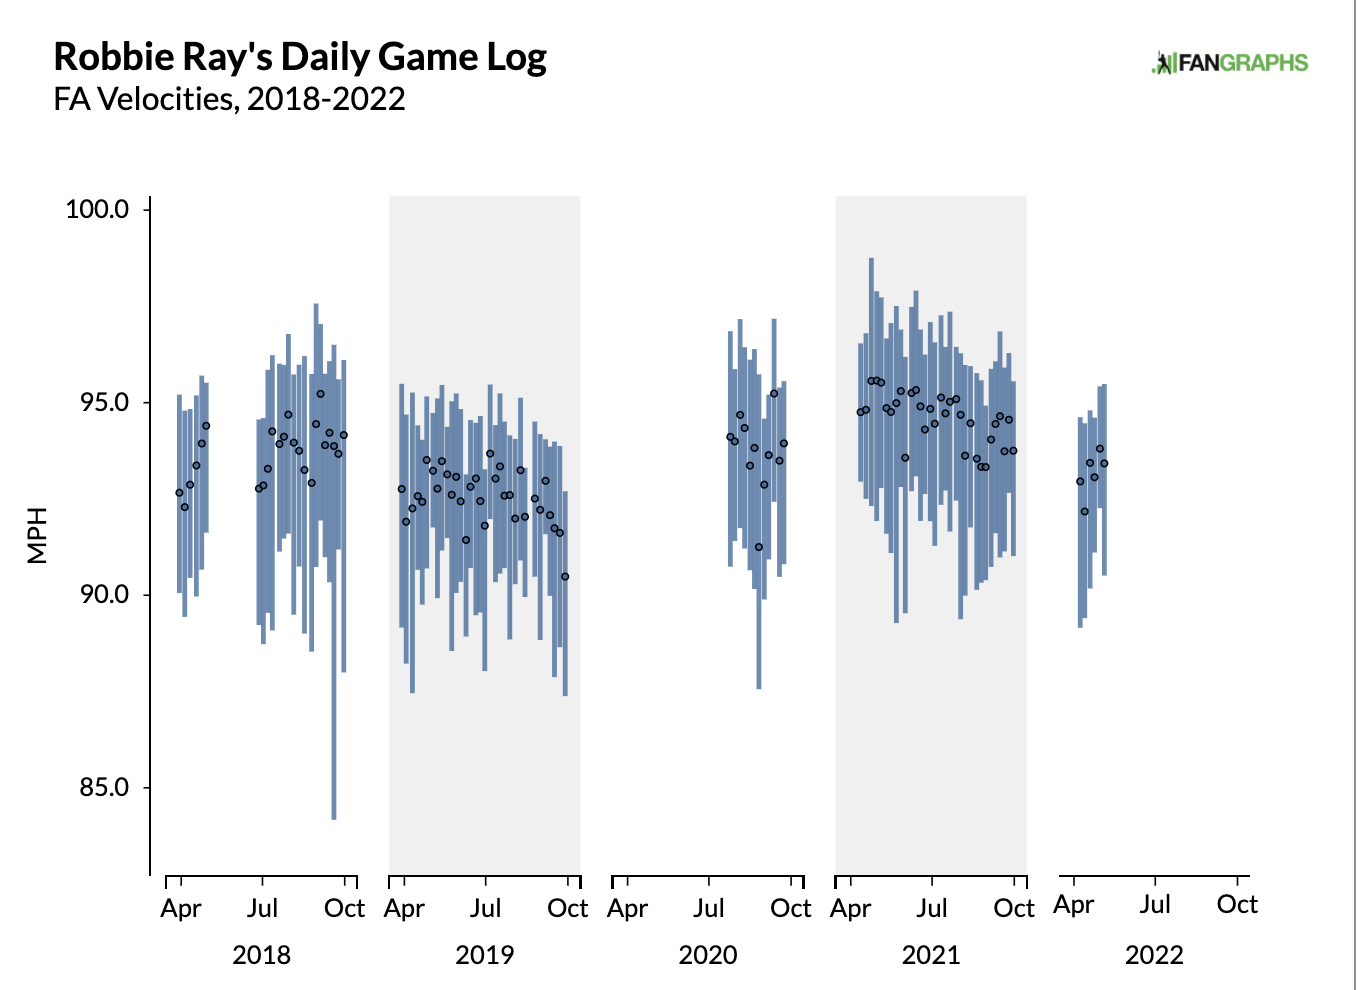
After mixing in a curveball and changeup close to 10% of the time in 2021, Ray has scrapped those offerings, too, using his fastball or slider 97.7% of the time this season.
He's hitting the zone more frequently than he has in prior seasons. Still, Ray can't blow mistakes by hitters as frequently at a lower velocity. His swinging-strike rate (12% vs. 12.7% career and 12.6% in 2020) is most telling after sitting at a career-high (15.5%) in 2021.
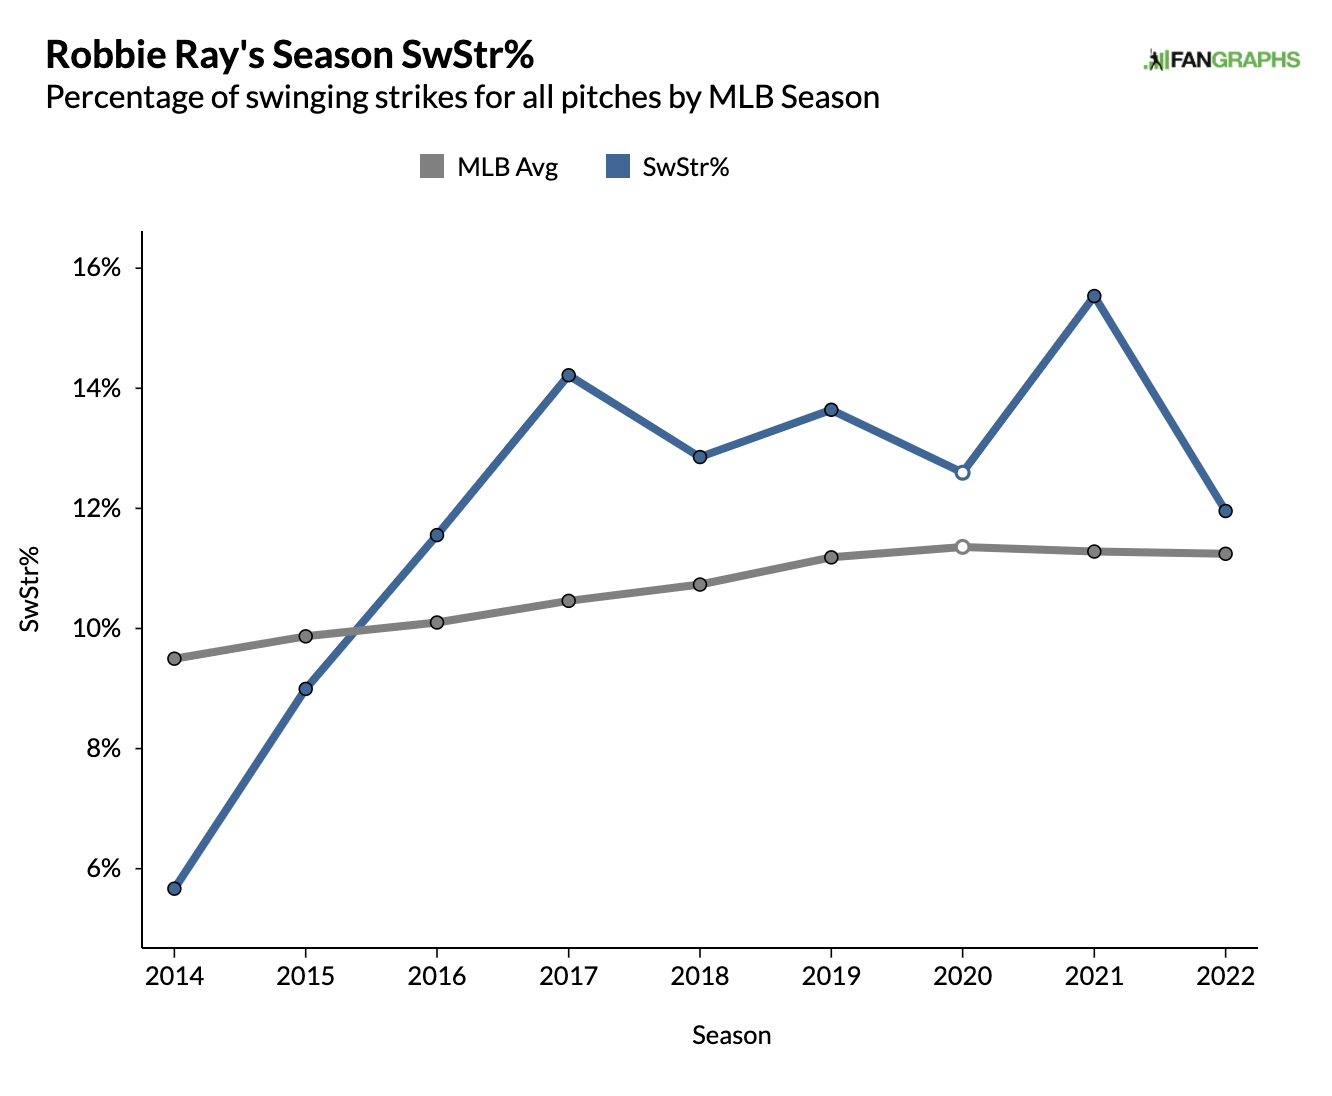
Unless Ray's peak velocity returns, it's hard to imagine him paying off that big contract. Sitting at 0.3 WAR through six starts, he's only pacing for 1.6 to 2 WAR over an entire season, well below the benchmark to meet his $23 million AAV.
While I would need -112 or better to play the Phillies' full game moneyline, I'm more than content with their F5 line up to -124 (projected 57.2.% or -134 implied).
Recommended Bets
- Philadelphia Phillies F5 (-115) at DraftKings (bet to -124)
Colorado Rockies vs. San Francisco Giants
Antonio Senzatela vs. Alex Wood
| Rockies Odds | +170 |
| Giants Odds | -190 |
| Over/Under | 7 (-130/+110) |
| First Pitch | 9:45 p.m. ET |
Model Projection (full projections here)
- Rockies probability: 36.9% (fair odds of +171)
- Giants probability: 63.1% (-171)
- Projected total: 7.62
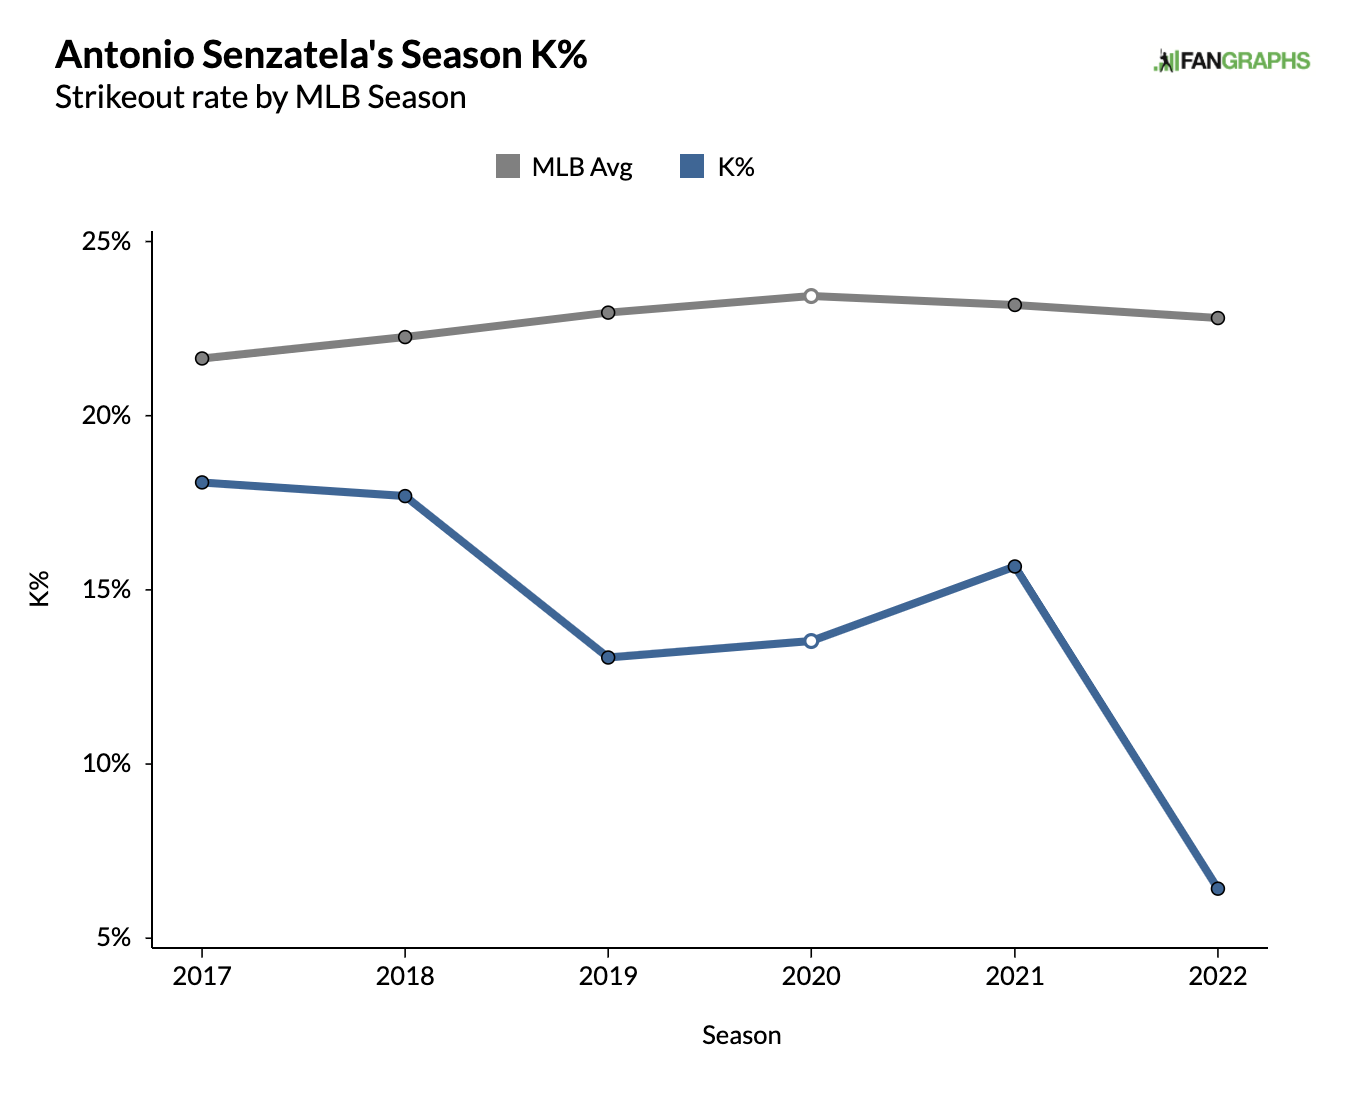
When the Rockies extended Senzatela through 2026 (five years, $50 million), I was shocked. He's a league-average pitcher at the very best with the 10th-lowest strikeout rate (14.5%) in baseball since 2018 (amongst 508 qualified pitchers).
And he's taken that approach to new extremes this season (5 BB, 7 K in 24 IP) while missing fewer bats and generating fewer called strikes than ever before (19.3% called strike plus whiff rate; 24.7% career).
His approach is relatively limited, too, using his fastball or slider a combined 92.8% of the time.
Despite a BABIP north of .400, Senzatela has only a 3.75 ERA (6.49 xERA, 4.72 xFIP, 5.31 SIERA). Still, if he continues to post such low strikeout totals, he will eventually get tagged.
Conversely, amongst 189 qualified starters, Alex Wood ranks 36th (top 20%) in K-BB% the last two seasons (19.2%) with a compelling fastball/slider/changeup mix that has worked against both lefties and righties.
Senzatela has a wide range of outcomes on his FIP projections (4.10 to 5.02). While Wood is almost an entire run lower (3.66 to 3.79) in the aggregate, he's still closer to a mid-rotation or a No. 4 pitcher and further down the pecking order in the Giants' rotation.
I showed a slight edge on the Giants F5 moneyline (projected 65%) at FanDuel overnight, but I wouldn't bet that number past -175, and I doubt that it's around by the time this article is published (which is part of the reason that you should follow me in the Action Network App).
Still, I project value on the over for both the first five innings (projected 4.19) and the full game (projected 7.62), and I would bet those two totals up to 4 (+100) and 7 (-114), respectively.
Recommended Bets
- Rockies/Giants, F5 Over 3.5 (-115) at MGM (bet to 4 (+100))
- Rockies/Giants, Over 7 (-110) at MGM (bet to -114)
- San Francisco Giants F5 (-172) at FanDuel (bet to -175)
Bets (May 10)
- Athletics/Tigers Game 2 Under 7.5 (+100) at MGM (bet to -104)
- Detroit Tigers Game 1 F5 (-102) at Fanduel (bet to -102)
- Dodgers/Pirates, Under 8.5 (-115) at MGM (bet to 8 (-108))
- Guardians/White Sox Under 8 (-105) at MGM (bet to -110)
- Kansas City Royals F5 (+120) at DraftKings (bet to +120)
- Kansas City Royals (+120) at Wynn (bet to +118)
- Los Angeles Dodgers F5 (-0.5, -145) at MGM (bet to -150)
- Milwaukee Brewers F5 (-0.5, -125) at MGM (bet to -130)
- Minnesota Twins (+125) at DraftKings (bet to +121)
- New York Mets F5 Team Total Over 2.5 (+120) at DraftKings (bet to +100)
- New York Yankees F5 (-150) at FanDuel (bet to -150)
- Orioles/Cardinals, Udner 8 (-107) at Rivers (bet to -110)
- Philadelphia Phillies F5 (-115) at DraftKings (bet to -124)
- Rays/Angels, Over 8 (-114) at Caesars (bet to -118)
- Red Sox/Braves, F5 Under 4 (-115) at MGM (bet to -130)
- Red Sox/Braves, Under 7.5 (+100) at Wynn (bet to -105)
- Rockies/Giants, F5 Over 3.5 (-115) at MGM (bet to 4 (+100))
- Rockies/Giants, Over 7 (-110) at MGM (bet to -114)
- San Francisco Giants F5 (-172) at Fanduel (bet to -175)
- Tigers/Athletics Game 1, F5 Under 3.5 (-125) at MGM (bet to -130)


