In a recent article on ESPN.com, Ben Alamar analyzed LeBron James' playoff impact and concluded that the four-time NBA MVP does, in fact, flip a switch, specifically on the defensive end of the floor.
While Alamar provides metrics and data to make his case, I decided to take this one step further and determine whether "playoff LeBron" exists when comparing his results to betting-market expectations.
The Spread
By comparing LeBron's regular-season against the spread (ATS) results to those from the playoffs, we can gauge how his teams perform against expectations set by the very efficient betting market. For example, if the Cavaliers close as seven-point favorites in a certain game and win by 12, we can conclude that Cleveland outperformed expectations for that matchup. Conversely, by failing to cover the spread, we can label the Cavs as under-performers.
Using the historical betting data available at Bet Labs, I ran the numbers to see just how LeBron's teams perform in the regular season, then compared them to postseason results:
With a 58.41% ATS win rate in the playoffs, up from 50.16% in the regular season, it's clear that LeBron's teams outperform market expectations once the postseason begins. While analyzing the numbers, I also broke them out per season for a more detailed look.
LeBron's teams have qualified for the postseason 12 times in his career (not including this season) and have performed better ATS in the playoffs vs. the regular season nine times. Additionally, his teams have cumulatively failed to cover the spread by -0.28 points per game in the regular season, but that cover margin improves to +1.33 in the postseason.
Interestingly, since LeBron took his talents to South Beach in 2010, his teams have failed to improve on their regular season ATS results only once in the postseason. Considering LeBron initially left Cleveland for a better supporting cast, it's reasonable to assume that King James no longer felt the need to carry his teams to the playoffs, and instead paces himself before "flipping a switch" in the postseason.
Over/Under
While we can use the spread to determine expectations against opponents, closing totals can show how LeBron's teams performed compared to expectations for total points scored.
In the regular season, 53.47% of his team's games have gone under the total. That number drops to 47.64% in the playoffs. Below is a more detailed look, broken out by season.
Take a closer look at the numbers from 2008-09 on. In eight of the past nine playoffs, LeBron's teams have cashed under tickets at a lower rate than the regular season.
While betting overs has been the smarter play historically when playing LeBron's playoff totals, we can't simply conclude that his teams are worse defensively as these factors are already priced into the closing lines. In fact, since 2007, King James' teams have closed with an average total of 201.6 in regular-season games, but that drops to 195.4 in playoff games.
Oddsmakers are very skilled at leveraging mainstream media narratives, such as "playoff LeBron," to force recreational bettors to play bad numbers. For example, the idea of LeBron "flipping the switch" has been popular for years, and there's a very good chance that sportsbooks have shaded their totals, knowing that recreational bettors will blindly bet the under. This over-adjustment has created value on the total, as evidenced by 53.47% of postseason games landing over the closing number.
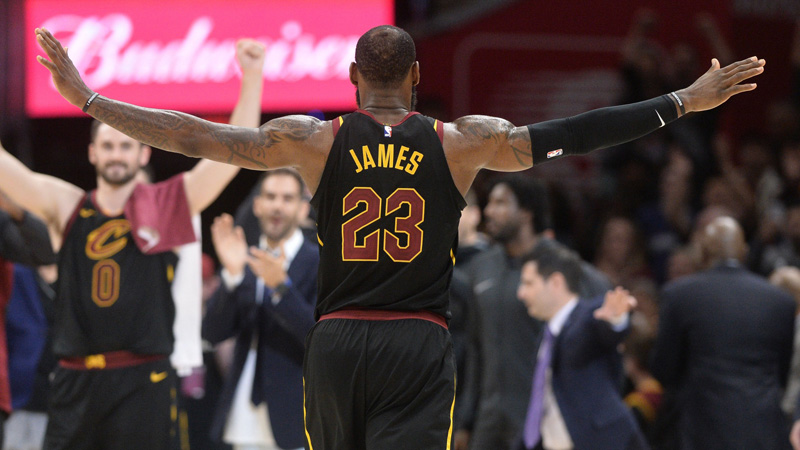
Top Photo: Cleveland Cavaliers forward LeBron James (23) celebrates the Cavs' victory over the Washington Wizards


