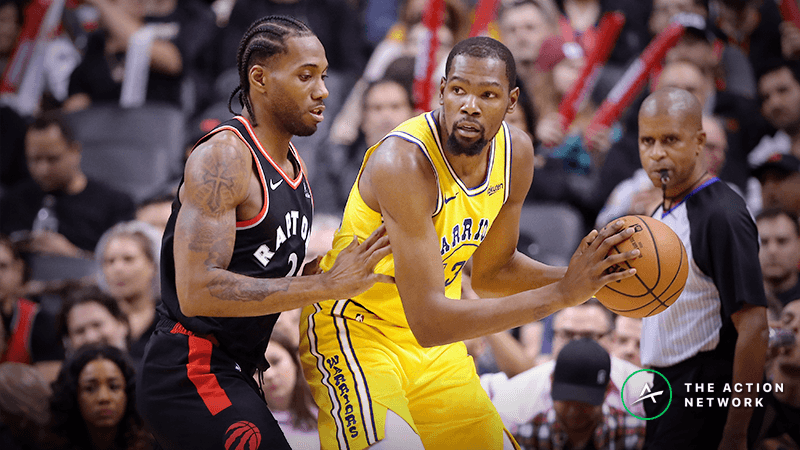
- Kevin Durant will miss the remainder of the 2019 NBA Finals against the Toronto Raptors after suffering an achilles injury during Game 5.
- Durant has missed a total of 49 games in his three seasons with the Warriors.
- Using Bet Labs, we analyze how the Warriors have performed with Durant off the court, both straight up and against the spread.
For the first time since injuring his calf in the third quarter of Game 5 of the Western Conference Semifinals against the Houston Rockets, Kevin Durant returned to the lineup in Game 5 of the NBA Finals vs. the Toronto Raptors.
Unfortunately for KD, the Warriors and really basketball fans as a whole, Durant re-injured his leg, this time his achilles and he will miss the remainder of the NBA Finals against Toronto.
For bettors, it is still very important to analyze how have the Warriors performed without Durant during his three seasons in the Bay Area, so we dug into our Bet Labs data to find out.
The Big Picture on Kevin Durant's Injury
Golden State split Games 1 and 2 in Toronto without Durant and then ended up losing by double-digits at home in Games 3 and 4 without KD in Oracle Arena.
In Game 5, Durant returned to the lineup, but re-injured his lower leg, but the Warriors were able to survive on the road in Game 5 without him.
The Warriors have played 49 total games over the last three seasons without Kevin Durant. They are 36-13 SU and 26-22-1 ATS in those games.
In the three playoff runs now with KD on the roster, Golden State has played eleven playoff games without the former MVP — The Warriors are 8-3 straight up and 6-4-1 against the spread.
Before this injury in the Western Conference Semifinals against the Rockets, Durant last missed a playoff game for Golden State in 2017 against the Blazers. Ironically enough, Durant missed both of those games also with a left calf injury and ended up playing just 20 minutes of action in his return eight days later.
Kevin Durant's left calf discomfort started late in the third quarter in Game 1. Played/scored through it, but issue apparently lingered pic.twitter.com/2ldgMclKYQ
— Anthony Slater (@anthonyVslater) April 18, 2017
The Curry Effect
One of the biggest questions surrounds how the loss of Durant affects Steph Curry. The Warriors have played seven total games without both Durant and Curry and are 1-6 SU and ATS in those matchups.
On the flip side, the Warriors have played 42 total games without Durant, but with Curry healthy. Golden State is 35-7 SU and 25-16-1 ATS in those 42 games, winning by 10.1 points per game and covering the spread by 3.4 points per game.
Can the Warriors Still Score?
In the Kevin Durant era, the Warriors are averaging 115.4 points per game, the highest mark in the NBA by 2.5 PPG over the Rockets.
With Durant on the floor, that number ticks up to 116.5 ppg. But without KD, that average plummets to 110, which would rank 21st in the league this season.
So, how does the lack of scoring affect the over/under? In the 49 games without Durant, the under is 31-18 (63.3%), landing under the total by 5.6 points per game.
When Durant is out and Curry is in, the under is 27-15 (64.3%), going under the total by 5.6 points per game.
The Metrics Without Durant
In the first two rounds of the 2019 playoffs, the Warriors played 151 minutes with Kevin Durant off the floor, compared to 430 minutes with him on the floor.
Golden State was virtually the same team offensively when it comes to advanced efficiencies.
In those 151 minutes, the Warriors have an Offensive Efficiency of 115.3 (points per 100 possessions), including a 56% eFG% (field-goal percentage that weighs 3-point field goals higher) and a 2.10 assist-to-turnover ratio.
In all three categories, the Warriors were more efficient with Durant off the floor than with him on against the Clippers and Rockets. When he is on the floor, this is how they stack up: 115.1 Offensive Efficiency, 55.4% eFG% and 1.98. assist-to-turnover ratio.
Since Durant's initial injury in Game 5 of the Rockets series, including Game 5 of the Finals, the Warriors have an Offensive Efficiency of 108.4 and a Defensive Efficiency of 107.6 with an eFG% of 53.5% in 473 minutes of play with Durant off the floor.
Let's take a look at how the Warriors have performed as a whole with Durant on and off the floor in 2019 compared to Golden State's previous two Finals runs…
When you compare those figures to the previous two Golden State title runs, you notice a distinct difference.
Right after Durant went out with his calf injury, the Warriors were able to keep up their efficiency numbers across the board. After the last few games against the Raptors, Golden State has looked mortal without KD.
To be fair, if you compare the 2019 margins to 2017 and 2018, Durant's impact becomes very clear, especially Golden State's eFG% differentials.
Can The Warriors Hold On?
The Warriors are now down 3-2 against the Toronto Raptors after escaping Toronto in Game 5 with a 1-point win.
Golden State has played five home games where it was listed as a favorite of 7 points or less and Durant missed the game. The Warriors are 1-4 straight up and 0-5 against the spread, failing to cover the number by 10.4 points per game.
In the 2019 NBA Finals, the Warriors have an Offensive Efficiency of 104.1, a Defensive Efficiency of 111.2 and a eFG% of 50.5%.
Let's compare that to the Warriors efficiency numbers in their four previous trips to the NBA Finals…
2018 Finals (beat Cavaliers)
120.1 Offensive Efficiency | 104 Defensive Efficiency | 58.9% eFG%
2017 Finals (beat Cavaliers)
117.5 Offensive Efficiency | 111.6 Defensive Efficiency | 55.3% eFG%
2016 Finals (lost to Cavaliers)
104.7 Offensive Efficiency | 105.3 Defensive Efficiency | 51.2% eFG%
2015 Finals (beat Cavaliers)
104.4 Offensive Efficiency | 93.8 Defensive Efficiency | 50.3% eFG%


