This is March. The bracket is set, and the field of 68 is ready for tip-off.
These games always have teams with contrasting styles, leaving oddsmakers with the task of opening a total.
Gonzaga and North Texas represent the fastest and slowest pace in the tournament, while games will take place in unfamiliar venues such as Buffalo, Milwaukee and San Diego.
The first-round pace report will look at the adjusted tempo metrics from KenPom and estimate if a total deserves a look in the case that two teams love playing in transition or half-court sets.
Another head-to-head factor is free-throw rate. While Arkansas has one of the largest offensive free-throw rates in the nation, Saint Mary’s will bring the worst rates in getting to the charity stripe.
Here is a look at the most important Round of 64 matchups from a tempo perspective through Thursday and Friday.


North Carolina vs. Marquette
North Carolina Tempo: 38th
Marquette Tempo: 27th
Total: 152
Toggle the dropdowns below to hide or show how North Carolina and Marquette match up statistically. Data via KenPom as of Sunday, March 13:
North Carolina Offense vs. Marquette Defense
Offense | Defense | Edge | |
| eFG% | 73 | 40 | |
| Turnover % | 56 | 130 | |
| Rebound Rate | 106 | 306 | |
| Free Throw Rate | 187 | 170 |
Marquette Offense vs. North Carolina Defense
Offense | Defense | Edge | |
| eFG% | 68 | 169 | |
| Turnover % | 102 | 347 | |
| Rebound Rate | 330 | 2 | |
| Free Throw Rate | 278 | 9 |
Pace of Play
| Tempo | 38 | 27 |
With an opening total of 149.5, this East Region matchup took immediate over money to drive the total to 152 by Monday morning.
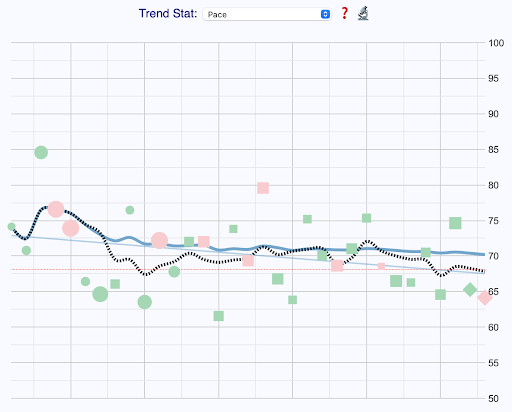
There’s good reason for the markup, as both North Carolina and Marquette finished top 40 in adjusted tempo. The KenPom projection of a 77-75 game pushed the overnight number where oddsmakers are looking to take two-way action.
Both teams love to push tempo, but Marquette is one of the fastest in the nation with a rank of fifth in average offensive possession length.
The Golden Eagles score points in transition at a frequency of 107th in the nation, but it's the pick and roll that’s on the menu for head coach Shaka Smart. North Carolina saw plenty of that offense in ACC play and will be ready for the combination of Justin Lewis and Darryl Morsell.
North Carolina also spends time in transition and ranks 62nd in off-the-dribble 3-point attempts. When the transition offense fails to produce points, the Tar Heels run plenty of post-up plays to get on the board. Marquette’s defense is one of the best in the nation in allowing points at the rim along, owning a rank of 28th in post-up efficiency.
The Golden Eagles defense has defended transition and post-up with success in Big East play. There has also been a noticeable drop in North Carolina’s tempo over the past 10 games in ACC play.
One aspect of taking an over/under is the free-throw rate. Marquette hardly gets to the charity stripe with a rank of 278th in offensive rate. That’s crucial against a North Carolina team that rarely fouls. The Tar Heels also get to the free-throw line at a modest rate with a rank of 187th.
There may be room to take an under in this game, considering the lack of execution in transition and a minimal number of free-throw attempts. Look for steam on the current market and fire on an under at 152 or better.
Pick: Under 152 or Better


UCLA vs. Akron
UCLA Tempo: 252nd
Akron Tempo: 348th
Total: 128.5
Toggle the dropdowns below to hide or show how UCLA and Akron match up statistically. Data via KenPom as of Sunday, March 13:
UCLA Offense vs. Akron Defense
Offense | Defense | Edge | |
| eFG% | 147 | 137 | |
| Turnover % | 5 | 240 | |
| Rebound Rate | 56 | 76 | |
| Free Throw Rate | 198 | 74 |
Akron Offense vs. UCLA Defense
Offense | Defense | Edge | |
| eFG% | 75 | 63 | |
| Turnover % | 130 | 85 | |
| Rebound Rate | 149 | 50 | |
| Free Throw Rate | 4 | 125 |
Pace of Play
| Tempo | 252 | 348 |
There may be nothing that makes UCLA head coach Mick Cronin happier than getting his Bruins into a slow-placed bruise fest. That’s certainly the forecast for the opening game against Akron.
The Zips are one of the slowest teams in the nation, ranking outside the top 300 in both offensive and defensive average possession length. Akron prefers to run a high rate of half-court sets with execution from the post.
Sophomore Ali Ali may be defended by Jaime Jaquez Jr., which would make for a sure-fire 12-round heavyweight bout between two players who love contact.
With the projected tempo dictating a low-scoring game, have the oddsmakers gone too far in setting such a low total? Akron is fourth in the nation at getting to the free-throw line, while UCLA is trending in the wrong direction for defensive free-throw rate, per BartTorvik.
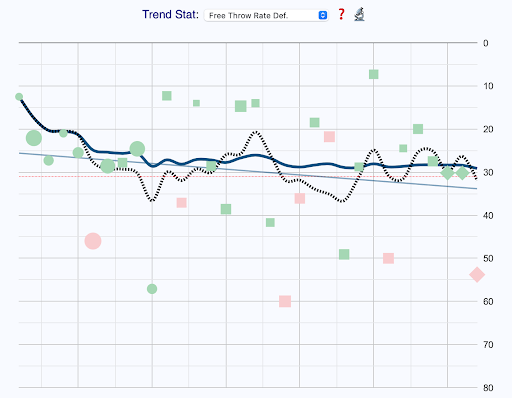
UCLA’s fouling may not be the issue with a point spread that suggests the Bruins cruise in this game. Cronin’s team shot 74% in conference play from the free-throw line, which may come into play when a multiple-possession lead comes in the second half.
The most important aspect of this game is that both offenses have advantages in their preferred offensive styles. UCLA runs isolation in the half-court offense, which give it heavy advantages against Akron, according to efficiency numbers in those respective categories.
Akron is excellent in the pick and roll and can get hot from the perimeter, ranking top-60 in catch-and-shoot or off-the-dribble 3-point attempts. UCLA ended the season ranked 282nd in defending catch-and-shoot 3s.
Both the Zips and Bruins have advantages in their offensive styles, while both also hold advantages in getting to the free-throw line.
The market opened at 129.5 and took steam on Sunday night down to 128.5. With a KenPom projection of 129 and a ShotQuality number of 133, this number is worth an over at 128.5 or better.
Pick: Over 128.5 or Better


Ohio State vs. Loyola Chicago
Ohio State Tempo: 281st
Loyola Chicago Tempo: 313th
Total: 132.5
Toggle the dropdowns below to hide or show how Ohio State and Loyola Chicago match up statistically. Data via KenPom as of Sunday, March 13:
Ohio State Offense vs. Loyola Chicago Defense
Offense | Defense | Edge | |
| eFG% | 23 | 48 | |
| Turnover % | 59 | 88 | |
| Rebound Rate | 154 | 38 | |
| Free Throw Rate | 86 | 126 |
Loyola Chicago Offense vs. Ohio State Defense
Offense | Defense | Edge | |
| eFG% | 8 | 81 | |
| Turnover % | 175 | 331 | |
| Rebound Rate | 278 | 207 | |
| Free Throw Rate | 125 | 155 |
Pace of Play
| Tempo | 288 | 307 |
There may not be a team in the tournament that struggled more down the stretch than Ohio State. Losers of four of their final five games, the Buckeyes managed a 10-9 record in Quad 1 and Quad 2 games this season.
While junior EJ Liddell has been one of the best players in the nation, a laundry list of injuries may accompany the Buckeyes into the opening game.
Head coach Chris Holtmann runs an offense that ranks 317th in average possession length on offense, focusing on half-court sets and post-up plays for points.
Loyola Chicago will oblige in the slow grind of the game. The Ramblers finished the season bottom-10 in the nation in average possession length on the defensive side of the court.
They have the second-highest frequency in the nation in running a half-court set, using plenty of pick and roll and isolation plays to score points.
Ohio State has great defensive efficiency ranks against what Loyola Chicago wants to do on offense.
Considering neither of these teams has an edge in getting to the free-throw line, this game has a projected total of 124.5, per ShotQuality.
If Ohio State’s injury report is loaded, look for Loyola to set up in the half-court and challenge the Buckeyes defense by using all 30 seconds of the shot clock.
Pick: Under 132 or Better


Texas vs. Virginia Tech
Texas Tempo: 341st
Virginia Tech Tempo: 344th
Total: 124.5
Toggle the dropdowns below to hide or show how Texas and Virginia Tech match up statistically. Data via KenPom as of Sunday, March 13:
Texas Offense vs. Virginia Tech Defense
Offense | Defense | Edge | |
| eFG% | 174 | 124 | |
| Turnover % | 159 | 139 | |
| Rebound Rate | 62 | 94 | |
| Free Throw Rate | 111 | 49 |
Virginia Tech Offense vs. Texas Defense
Offense | Defense | Edge | |
| eFG% | 20 | 39 | |
| Turnover % | 97 | 14 | |
| Rebound Rate | 178 | 254 | |
| Free Throw Rate | 333 | 316 |
Pace of Play
| Tempo | 341 | 344 |
Oddsmakers curbed the appetite for an under with an opener of 124.5 in a game featuring the two slowest tempos in the tournament.
The Hokies rank 333rd in average possession length on the offensive end, a number that suggests Virginia Tech will walk the ball up the court against a Texas drop defense that is 350th in average defensive possession length.
The bigger issue for Texas may be point distribution, as the Longhorns finished 90th in getting points from the charity stripe. In comparison, Chris Beard’s team is 131st from 2-point and 256th in 3-point distribution. Virginia Tech ranks 50th in defensive free-throw rate, which may eliminate the Longhorns’ main pipeline to points.
Virginia Tech got hot during the ACC Tournament, shooting 45% from the perimeter against North Carolina and Duke. The Hokies love to shoot the 3, ranking 31st in point distribution and third in the nation in 3-point percentage.
There’s a high efficiency rank no matter what kind of perimeter shot is taken, which is bad news for a Texas defense that ranks 175th in defending the off-the-dribble 3-pointers.
That should be the main handicap from the game, as the Longhorns are one of the best half-court and post-up defending teams in the nation.
If Virginia Tech is on from the perimeter, the Hokies will prevail and give this short total a run to the over. Wait for the steam to hit the market, as the number has dropped below 124 through Monday morning.
Pick: Virginia Tech Team Total Over 62 or Better


