What is the Holy Grail of college football gambling? Integrating as many statistics as possible over the past decade to find patterns that result in successful betting has been the ultimate mission objective.
Box scores from the past contained total yards, turnovers and completion rates, but for every standard statistic, there are another dozen that can help an investor.
With the invention of elusiveness, average depth of target and drop rates, the game of college football has become more advanced.
The start of these numbers first appeared in the definition of the Five Factors. Handicappers have long known that Success Rate — also known as moving the ball on schedule — is the most dependable stat to determine the winner of a football game. The outstanding question is if Success Rate is reliable in picking a straight-up winner, does the same metric apply to covering the spread?
This article will take a deep dive into a handful of advanced stats from Success Rate, Explosiveness, Finishing Drives and Havoc. Combining those numbers over a five-year sample versus a team's final against-the-spread record may shed light on which advanced statistics deserve a highlight in 2021 box scores.
Our first dive goes into the ranks of teams that finished above 60% against the spread since 2016. The sample set supplies us 169 data points over a span of five years. Below is a look at the average rank of teams greater than 60% in each respective statistic.
Alabama led the nation in Success Rate during 2020, putting up an undefeated record and a 9-4 mark against the spread.
Iowa led the country in stopping explosive plays, which helped a 5-2 record against the number.
Kent State dominated the Finishing Drives category on offense last season, averaging 5.1 points per trip past the 40-yard line.
Like clockwork, Clemson was the leader in the clubhouse in defensive Havoc. With the pipeline of recruiting and a new contract for Brent Venables, the Tigers will continue to create chaos.
Doesn't matter how big you are don't tug on Clemson D-coordinator Brent Venables' shirt pic.twitter.com/QYbTb7pJ6m
— gifdsports (@gifdsports) October 1, 2017
College football has turned into an offensive game in recent years, as the up-tempo RPO and Air Raid styles of play migrated from the Big 12 to the SEC.
Plenty of defensive schemes are changing to combat quarterbacks who create mismatches in space. Ohio State has created the new hybrid "bullet" position with hopes of finding a Roquan Smith or Isaiah Simmons like Georgia and Clemson did in years past.
Teams that have been late to the party in terms of offensive and defensive scheme have continued to be losing wagers year after year. The against-the-spread numbers for teams below 40% paint a troubling picture in each of the Five-Factor categories.
Nebraska must get the offense clicking in Year 4 of the Scott Frost era. The Cornhuskers averaged less than a point after crossing the opponent's 40-yard line.
Havoc rates have plummeted for head coach David Shaw at Stanford, but a complete rebuild of the trenches has been in order.
While the Mike Leach Air Raid debut surprised LSU in 2020, the remainder of the season saw very few explosive plays.
With data points for teams over 60% and under 40% against the spread, the agenda becomes ranking which statistical categories have been most important in winning bets.
This is done by taking the average rank for both sides of the ball and generating the deviation from the midpoint of 130 FBS teams.
Success Rate is the most predictive stat when calculating a team's transfer activity and returning production (TARP). Not only is Success Rate predictable, but the stat serves as a thermometer for a team's ability to cover the spread.
Defensive Success Rate is the most defining statistic for both winning and losing teams. Teams that cover the spread over a 60% clip generally rank 47th or better in defensive Success Rate. Teams that cover the spread less than 40% of the time own an average Success Rate rank of 81st or worse.
There are plenty of teams entering 2021 with plenty of returning players that ranked highly in defensive Success Rate. Teams that finished top-10 in 2020 and return more than 83% on defense include Tulsa, Clemson, TCU and Wisconsin.
The same can be said for teams that struggled in getting offenses off the field. Minnesota, Eastern Michigan, Oregon State and Ole Miss represent defenses that finished 2020 in the bottom 10 in Success Rate while returning more than 80% of players for 2021.
The next most important statistic is defensive Finishing Drives. Only Wisconsin and Alabama have allowed fewer points on average than Northwestern since 2016.
Northwestern’s defense can absolutely BALL! One of the best interceptions you’ll ever see.pic.twitter.com/4TMeNJFZZG
— Sam Levitt (@SammyLev) December 19, 2020
Next on the list is the importance of Havoc, a stat that is a leading indicator on whether or not a team will cover the spread.
While Clemson is the obvious choice to continue its ways with defensive Havoc, keep eyes on reigning MAC champion Ball State. The Cardinals finished 2020 with a top-five rank and return more than 80% on the defensive side of the ball.
Mike Houston is in need of a change in his third year at East Carolina, a program plagued with inconsistency on offense. The 2020 version of the Pirates finished 124th in offensive Havoc and return 91% of their offense in 2021.
.@TulsaFootball scored 31 points in the second-half to remain unbeaten in conference play. QB Zach Smith threw for 253 yards and two touchdowns while the defense forced three East Carolina turnovers.#AmericanPow6rpic.twitter.com/YfCpxLirWt
— The American (@American_Conf) October 31, 2020
Offensive Success Rate makes an appearance halfway down the board.
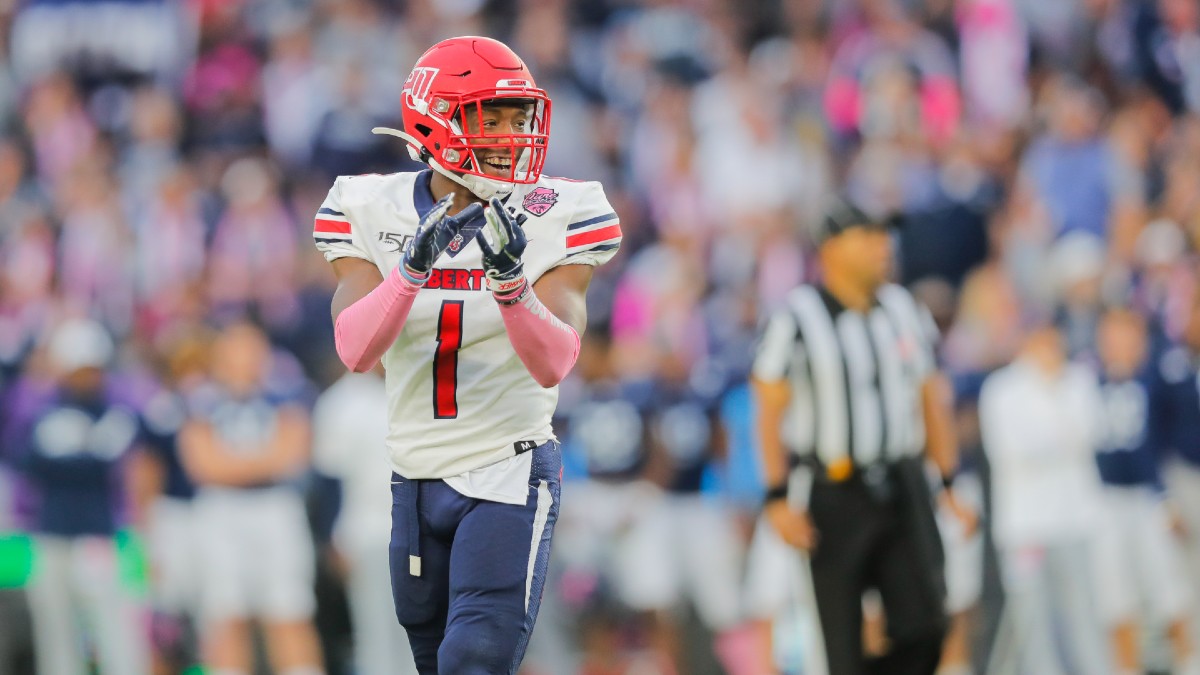
In a 2021 season that has a record-breaking number of returning athletes, a few programs are well ahead of others in Success Rate. Iowa State, Liberty, Kent State and Louisiana finished top-25 in offensive Success Rate during the 2020 season and return at least 90% for 2021.
In summary, while explosive plays are all the rage in college football, it does not equal winners at the window.
Data from the past five years indicates defensive Success Rate, Havoc and Finishing Drives are the biggest indicators in beating oddsmakers this college football season.


