We've all had enough bad beats to understand that the final score does not always do the best job of reflecting each team's performance. This weekly column highlights matchups where the advanced box score tells a different story than the game's result. Sports bettors may want to keep this information in the back of their minds before placing next week's college football wagers.
Check out our new NCAAF PRO Report, where we highlight factors that provide betting edges — like large wagers, historically profitable betting systems, model projections and expert picks — that when combined with sharp money can powerfully detail the smartest bets on a given slate.
Deceiving Blowouts
These teams may have cruised to victories over the weekend, but the box score indicates that the game may have been closer than it appeared.
BYU 43, Houston 26
BYU remains undefeated after a 17-point victory at Houston, but this game was much closer than what we can see in the final score. Houston was actually more successful on a per-play basis, posting a 43% success rate to BYU's 41%. However, BYU was able to hit the explosive plays when it needed to, which proved to be the difference. BYU was able to generate three explosive drives that resulted in touchdowns: one play for 78 yards, seven plays for 85 yards, and five plays for 75 yards.
Clemson 73, Georgia Tech 7
Just kidding.
Wake Forest 40, Virginia 23
Virginia is becoming a regular in this section. For the second week in a row, Virginia had the higher success rate than its opponent and lost by multiple scores. Wake Forest was only to post a 37% success rate but managed to turn that into 40 points, while Virginia posted a 43% success rate. Virginia had eight trips past Wake's 40-yard line, but only averaged 2.88 points in those opportunities. The Deacons had one less trip inside the 40 than the Cavaliers but were able to finish, averaging 4.71 points per trip. Virginia also lost the turnover battle, 3-0, and allowed three touchdowns of over 40 yards.
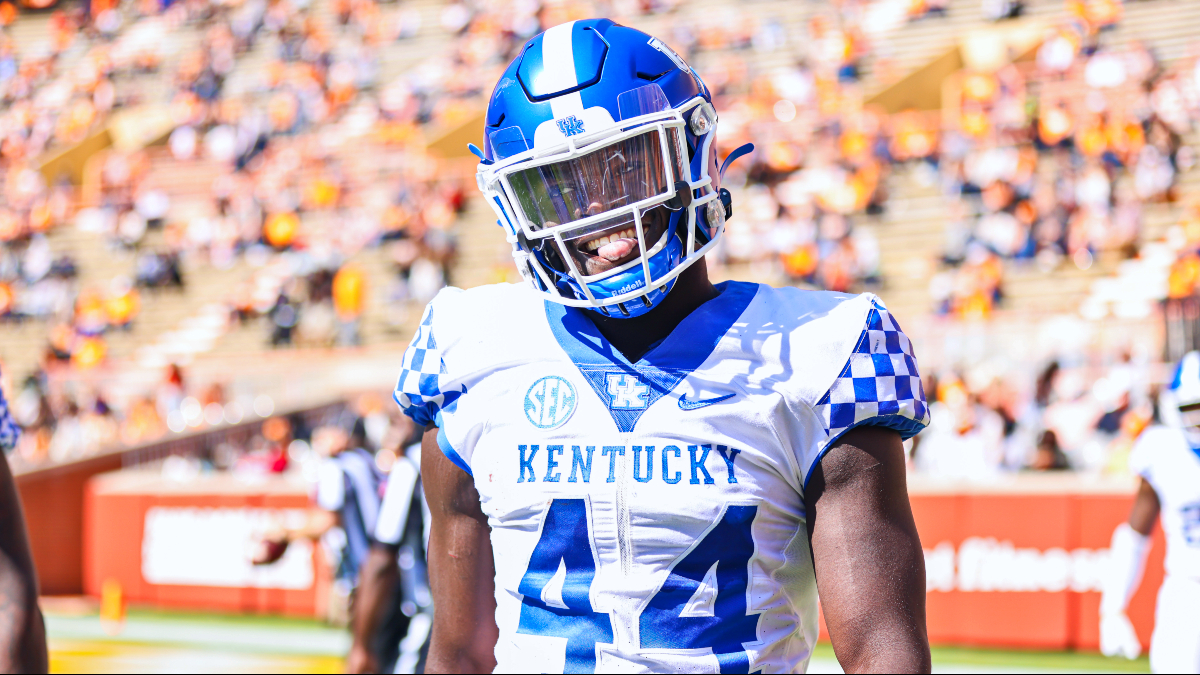
Kentucky 34, Tennessee 7
Things can get weird when you throw back-to-back pick sixes. Kentucky only had seven more offensive yards than Tennessee, and the Wildcats' success rates were almost equal. Having the defense chip in 14 points was more than enough to cover that up. Kentucky needed fewer than 300 offensive yards to cruise to a 27-point win.
Puzzling Point Totals
Everyone knows the terrible feeling of holding an over ticket, watching a team drive into the red zone and then witnessing that team fail to score a touchdown. Sometimes the total does not reflect the offensive efficiency that happened on the field.
Temple 39, South Florida 37
It's rare to see 76 total points in a game where neither team could generate at least 5.0 yards per play on offense. However, both Tempe and South Florida benefitted from having short fields. The average starting field position in this game was 62.4, which is significantly shorter than the FBS average of 70.3. Both teams were also able to make the most out of their opportunities in opposition territory. South Florida generated 4.22 points on drives past the opponent 40-yard line, and Temple was able to generate 4.86. The FBS average in that category is about 3.7.
UAB 37, Western Kentucky 14
The over/under in this game closed at 44, and under bettors probably deserved a win here. Neither team ran more than 70 plays, and both teams posted success rates in the 30's (FBS average is about 42%). Additionally, there were only 303 total passing yards and both quarterbacks averaged just 4.6 yards per attempt. However, UAB was able to block a punt that it returned for a touchdown and generated four turnovers.
Confounding Conclusions
This section features games where the final score simply did not line up with the box score.
Arkansas State 59, Georgia State 52
Georgia State generated 7.7 yards per play compared to 6.3 for Arkansas State. However, in a shootout like this one, a few mistakes can be tough to overcome. Fourth down, in particular, did not go well for Georgia State. The Panthers were only able to convert one of four attempts, while Arkansas State converted three of its four attempts. This really was a "whoever has the ball last wins" type of game, and Georgia State fumbled on its final drive to seal the win for the Red Wolves.
Arkansas 33, Ole Miss 21
In an ideal world, you wouldn't have to worry about your quarterback throwing six interceptions. Unfortunately for Ole Miss, Matt Corral somehow managed to do just that. I know "take away the six interceptions" is an enormous caveat, but Arkansas' path to victory was not something that is sustainable going forward. Ole Miss actually had a slight advantage in success rate and yards per play. Against an Ole Miss team that has a case for the worst defense in the country thus far, Arkansas only generated two offensive touchdowns.
Florida State 31, North Carolina 28
Another case of a few plays swinging the outcome of a game. North Carolina had three more drives past the 40-yard line than Florida State, as well as a 47% success rate compared to 41% for the Noles. Florida State blocked two North Carolina punts, one of which coming just outside the UNC red zone. That block turned into a one-play, 23-yard touchdown drive for the Seminoles. If that wasn't bad enough for the Tar Heels, Florida State picked off quarterback Sam Howell in the second quarter and returned it for a touchdown. Florida State came away with a victory despite being outgained by over 100 yards.
>> Sign up for The Action Network's daily newsletter to get the smartest NFL conversation delivered into your inbox each morning.


