We've all lived through enough bad beats to understand that the final score does not always do the best job of reflecting each team's performance. This weekly column highlights matchups where the advanced box score tells a different story than the game's result.
Sports bettors may want to keep this information in the back of their minds before placing next week's college football wagers.
Check out our new NCAAF PRO Report, where we highlight factors that provide betting edges — like large wagers, historically profitable betting systems, model projections and expert picks — that when combined with sharp money can powerfully detail the smartest bets on a given slate.
Puzzling Point Totals
Sometimes, the total does not reflect the offensive efficiency that happened on the field. This section highlights the games where the total should have been significantly higher or lower than it actually was.
Notre Dame 45, Pittsburgh 3
Notre Dame absolutely deserved a win here, but its advanced metrics do not point to a 45-point output. The Irish were aided by a blocked punt and one long offensive touchdown. As a whole, Notre Dame only averaged 5.2 yards per play and a success rate of 41%, which is slightly below national average. The Irish ran the ball 50 times and only averaged 2.3 yards per carry.
Missouri 20, Kentucky 10
This section usually highlights a score that did not align with the box score, but I had to put this one in here for a different reason. Kentucky only ran 36 offensive plays? How is that possible? The Wildcats posted 145 yards of total offense and only managed 50 passing yards. Missouri, on the other hand, ran 92 plays on offense and put up 421 yards. Kentucky only had a 35% success rate, and were 2 for 9 on third downs. I didn't watch a second of this game, and I guess I'm glad I didn't.
Rutgers 38, Michigan State 27
You can really take your pick of which section this belongs in. There were far more points than what the advanced metrics would suggest, and Michigan State probably deserved a win. Rutgers only posted a 35% success rate, and Michigan State's was also unimpressive, at 41%. Rutgers also failed to reach 4 yards per play, while Michigan State averaged 4.5.
Rutgers was able to put up 38 points on only 170 pass yards and 2.6 yards per carry. Michigan State somehow managed to lose five fumbles and add another two interceptions, which pretty much sealed the deal. Rutgers had an incredible average starting field position of 54.6 yards from the end zone. Michigan State had some awful luck in Mel Tucker's first game as head coach.
Confounding Conclusions
This section features games where the advanced metrics would point to a much different result than what occurred in the final score.
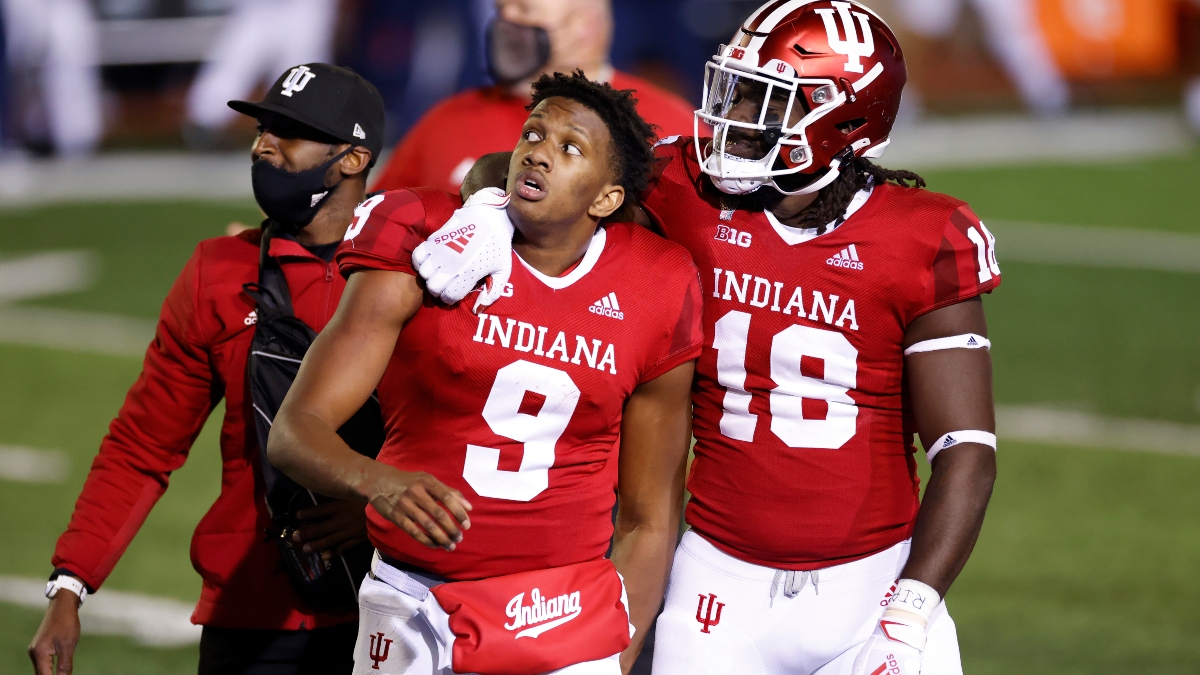
Indiana 36, Penn State 35
Penn State's postgame win expectancy was 100%, according to College Football Data. The Nittany Lions drove the ball past the opponent 40-yard line eight times compared to just five for Indiana, but they were unable to regularly capitalize on those opportunities. Despite having three more tries, Penn State only had 21 total points on its eight opportunities while Indiana was able to turn its five opportunities into 27 points.
Penn State had a massive advantage in success rate, as well, at 49% to Indiana's 33%. Penn State also had more than double the amount of yards as the Hoosiers. Quarterback Sean Clifford did throw an interception in his own red zone, which eventually played a big factor in Indiana getting an undeserving win.
Sometimes, I wonder why I bet real money on this sport.
Wake Forest 23, Virginia Tech 16
Winning the turnover battle is key in college football, and it's tough to overcome a 3-0 deficit in that department. However, Virginia Tech was the more efficient team on a per-play basis. Overall, the Hokies posted a 45% success rate compared to Wake Forest's 35%. Virginia Tech also out-gained the Deacons by over 100 yards and had a yards per play edge of 5.5 to 4.8.
The Hokies drove past the Wake Forest 40-yard line eight times in the game and came away with a total of 16 points out of those opportunities. Virginia Tech was also scoreless in four red-zone trips.
Purdue 24, Iowa 20
Iowa was the better team in almost every key metric but somehow found a way to lose to a Purdue team that was missing its head coach and one of the best players in program history. Iowa had a higher success rate (43% to 40%), more yards per play (6.1 to 5.0), and more total yards (455 to 386). Purdue was able to capitalize where it counted, however, and turned five trips past the Iowa 40-yard line into 24 points.
One area where Iowa really shot itself in the foot was penalties. The Hawkeyes had 10 for 95 yards, while Purdue only committed three. Iowa's postgame win expectancy was 85%.
Georgia State 36, Troy 34
I checked this score in the second quarter and Troy was leading 21-10, and got mad at myself for deciding not to take Troy -2. After I woke up this morning, I couldn't believe Georgia State won this game.
Troy was the more efficient team by a landslide, posting a 53% success rate while Georgia State came in at only 36%. It also outgained Georgia State by more than 2.0 yards per play: 6.7 to 4.4. Both teams had their fair shares of turnovers, but Troy's ended up being more detrimental. This led to Georgia State having an average starting field position that was 15 yards closer than Troy's.
After an unlucky loss a week ago, Georgia State came back to win a game it was outplayed in.


