Middle Tennessee vs. UAB Odds
| Middle Tennessee Odds | ||
|---|---|---|
| Spread | Total | Moneyline |
+9.5 -110 | 53 -110o / -110u | +275 |
| UAB Odds | ||
|---|---|---|
| Spread | Total | Moneyline |
-9.5 -110 | 53 -110o / -110u | -350 |
In a cross-division conference matchup, UAB hosts Middle Tennessee for a mid-afternoon game. Both teams are winless in conference play and will need to get a victory to keep pace with their respective division leaders.
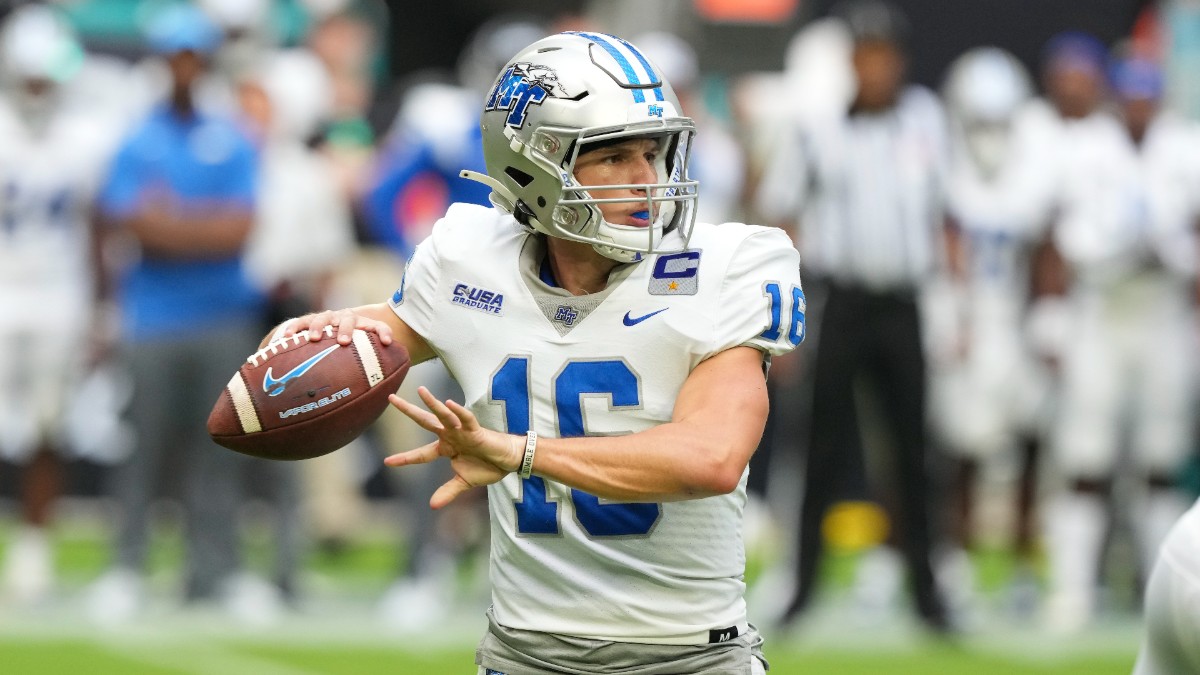
After pulling the upset over Miami (FL), Middle Tennessee failed to even cover against UTSA at home as a 4.5-point underdog. This dropped the Blue Raiders' season record to 3-2 and 3-2 against the spread. They have gone over in their last three games after starting the year with back-to-back unders.
UAB has had mixed results with a 2-2 record. It's 2-2 against the spread and has gone under in three of its first four games. The Blazers enter this game coming off of a road loss to Rice.
The weather should be clear for this game, with forecasted temperatures in the 70s and no precipitation expected. There could be some impact from wind, with forecasted wind speeds up to 11 miles per hour.
The loss to UTSA took a bit of shine off of the Blue Raiders coming off of their big win over Miami (FL). However, they still have a 3-2 record and have plenty of time to move their way up the Conference USA standings.
They're averaging 33 points per game and 5.5 yards per play. They have a 37% Success Rate and average 3.39 points per opportunity.
Middle Tennessee's offense has slightly preferred the pass with a 54% passing rate.
Quarterback Chase Cunningham has completed 68.2% of his passes for an average of 7.8 yards per attempt. He's thrown eight touchdowns and just three interceptions. As a team, the Blue Raiders have 39% Passing Success Rate and they have averaged 3.8 passes of 20 yards per game.
The Blue Raiders' run game is led by sophomore Frank Peasant. He's accumulated 305 rushing yards and six touchdowns through five games.
As a team, they are averaging just 3.2 yards per rush and own a 34% Rushing Success Rate. Their offensive line has allowed a 25.2% Stuff Rate and has only managed to generate 2.34 Line Yards per play.
Middle Tennessee has allowed 29 points per game and 5.2 yards per play. It has allowed a 40% Success Rate and 3.91 points per opportunity. The Blue Raiders generate Havoc on 20% of plays and have allowed an average of 4.6 20+ plays per game.
The Blazers sit at 0-1 in conference play and just a 2-2 record for the season, but this game could be a springboard for their season to get back to their 2021 levels of success.
They have averaged 29.5 points per game and 6.3 yards per play. They have a 44% Success Rate and have averaged 4.21 points per opportunity, but they have played at a super slow pace of 29.7 seconds per play, which ranks 129th nationally.
The Blazers lean heavily on the running game, but it's not due to a lack of passing success.
Dylan Hopkins has completed 68.5% of his passes for an average of 9.1 yards per attempt. He's thrown four touchdowns to just one interception. As a team, the Blazers have a 44% Passing Success Rate and have thrown two 20+ yard passes per game.
UAB runs the ball on 62% of its offensive plays. Leading the charge has been DeWayne McBride, who is averaging 6.9 yards per attempt.
As a team, the Blazers have a 44% Rushing Success Rate. Their offensive line has helped the cause with 3.18 Line Yards generated per attempt and a 15.4% Stuff Rate allowed.
The UAB defense has allowed just 17.5 points per game and 4.6 yards per play. It has allowed a 37% Success Rate and an average of 3.5 20+ yard plays per game.
The Blazers have generated Havoc on just 17% of plays, but they have managed to close out drives well with an average of 2.45 points per opportunity.
Middle Tennessee vs. UAB Matchup Analysis
Toggle the dropdowns below to hide or show how Middle Tennessee and UAB match up statistically:
Middle Tennessee Offense vs. UAB Defense
Offense | Defense | Edge | |
| Rush Success | 103 | 56 | |
| Line Yards | 126 | 59 | |
| Pass Success | 64 | 38 | |
| Pass Blocking** | 122 | 65 | |
| Havoc | 118 | 35 | |
| Finishing Drives | 107 | 11 | |
| ** Pass Blocking (Off.) vs. Pass Rush (Def.) | |||
UAB Offense vs. Middle Tennessee Defense
Offense | Defense | Edge | |
| Rush Success | 50 | 41 | |
| Line Yards | 116 | 34 | |
| Pass Success | 82 | 84 | |
| Pass Blocking** | 15 | 26 | |
| Havoc | 109 | 13 | |
| Finishing Drives | 50 | 74 | |
| ** Pass Blocking (Off.) vs. Pass Rush (Def.) | |||
Pace of Play / Other
| PFF Tackling | 12 | 81 |
| PFF Coverage | 51 | 7 |
| SP+ Special Teams | 43 | 101 |
| Seconds per Play | 24.4 (31) | 29.7 (124) |
| Rush Rate | 48.4% (95) | 65.5% (8) |
Data via CollegeFootballData.com (CFBD), FootballOutsiders, SP+, Pro Football Focus and SportSource Analytics.
Middle Tennessee vs. UAB Betting Pick
The high number of 9.5 doesn't seem to be scaring bettors off of UAB. As of this writing, 72% of tickets and 82% of the money has come in on the Blazers.
However, according to the Action Network PRO Report, sharp money has come in on Middle Tennessee.
The betting on the total has been significantly more even, with just 55% of tickets and 51% of the money on the over.
And the total is my preferred play in this game.
With a struggling Blue Raiders offense and a plodding UAB offense that will eat up clock, my preferred bet is on under 53.


