Tulane vs Tulsa Odds
| Tulane Odds | ||
|---|---|---|
| Spread | Total | Moneyline |
-6.5 -118 | 56.5 -110o / -110u | -275 |
| Tulsa Odds | ||
|---|---|---|
| Spread | Total | Moneyline |
+6.5 -104 | 56.5 -110o / -110u | +220 |
Tulane travels to Tulsa for an early-afternoon American Athletic Conference matchup.
Tulane enters this game with a 7-1 record and riding a four-game winning streak in conference play. It also has a 7-1 record against the spread and has gone under in five games.
Tulsa comes into this game with a 3-5 record and following an 11-point loss to SMU. The Golden Hurricane have a 3-5 record against the spread and have gone over in five games.
Weather could have an impact on this matchup. Temperatures will range from 48-60 degrees, and there's a low probability for precipitation during the game. But there will be wind ranging from 10.7 to 14 MPH expected.
These aren't expected to be crosswinds, however, which would have a greater impact on the game.
Defense Key to Tulane Green Wave
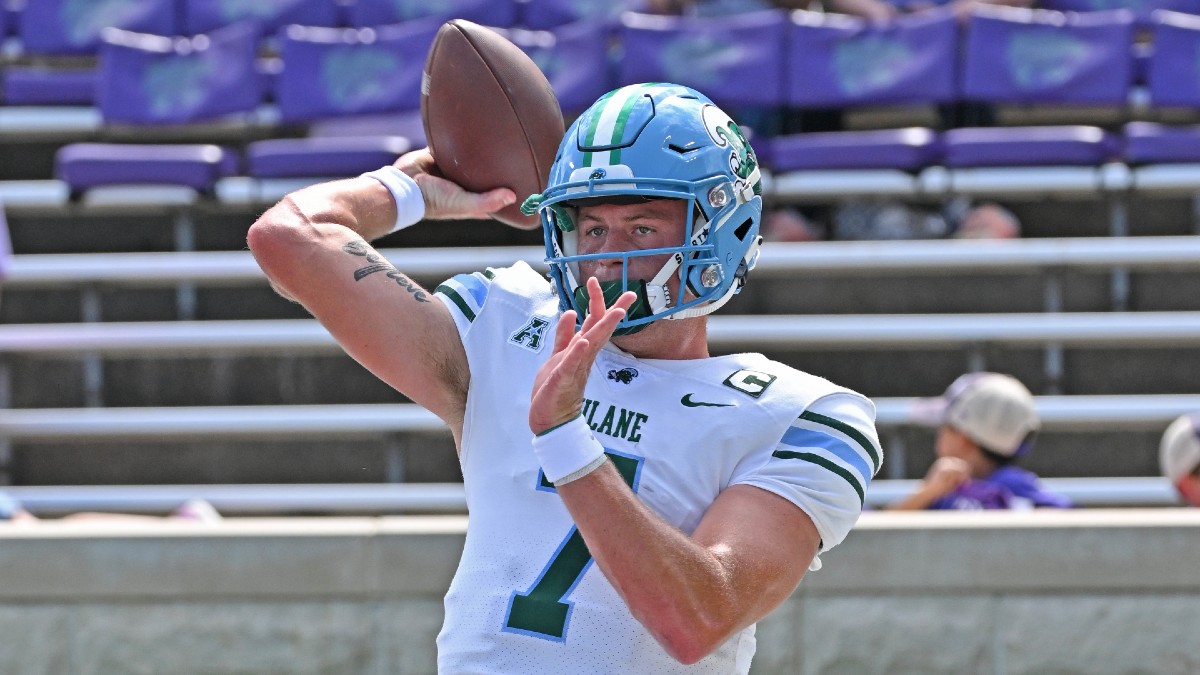
In the initial College Football Playoff rankings, Tulane checked in as the top Group of Five program at No. 19, and the Green Wave sit atop the AAC standings with a 4-0 conference record.
Tulane has averaged 33.6 points per game and 5.9 yards per play. The Green Wave have 44% Success Rate and average 4.04 points per opportunity. Their 27.1 seconds per play ranks 85th nationally.
Michael Pratt leads this offense that passes the ball 29.3 times per game. He's completed 67.5% of his passes for an average of 8.9 yards per attempt. He's thrown for 12 touchdowns and just three interceptions.
As a team, Tulane has a 47% Passing Success Rate and has thrown an average of 4.5 passes of more than 20 yards per game.
The Tulane Green Wave have averaged 40.3 rush attempts per game for an average of just 3.9 yards per attempt. Tyjae Spears is the clear leader in the backfield with 120 carries, 588 yards, and nine touchdowns. As a unit, Tulane has a 42% Success Rate. Its offensive line has generated 3.04 Line Yards per attempt and has allowed a 16.7% Stuff Rate.
Tulane's defense has allowed 17.4 points per game and 4.8 yards per play. It allows a 40% Success Rate and 3.66 points per opportunity. It's among the best in the nation at reducing explosiveness and has allowed just 2.75 20-plus yard plays per game.
It generates Havoc on 17% of plays, which ranks 76th nationally.
With its 1-3 conference record, Tulsa currently sits ninth in the AAC conference standings. It's averaged 32.4 points per game and 6.0 yards per play. It has a 44% Success Rate and scores an average of 4.82 points per opportunity.
With an average of 6.25 plays over 20 yards per game, this offense is among the most explosive in the nation. Its 25.0 seconds per play ranks 34th nationally.
Tulsa passes the ball on 53% of plays with an average of 35.3 pass attempts per game.
Davis Brin has led the way, completing 60.3% of his passes for an average of 8.8 yards per attempt. Through eight games, he has 2,090 yards, 17 touchdowns and seven interceptions. As a team, Tulsa has a 43% passing Success Rate and averages 4.75 20-plus yard passes per game.
Five players have at least 30 carries for the Golden Hurricane offense, and none has more than 75. As a unit, they average just 3.9 yards per carry. They have a rushing success rate of 45%. The offensive line has created an average of 3.22 Line Yards per attempt and has allowed a 14.2% Stuff Rate.
The Golden Hurricane allows an average of 34 points per game and 5.6 yards per play. They've allowed a 40% Success Rate. One main area for concern has been their opponents' ability to finish drives.
They allow an average of 4.37 points per opportunity, which ranks 115th, and they've generated Havoc on only 15% of plays, which ranks 105th.
Tulane vs Tulsa Matchup Analysis
Toggle the dropdowns below to hide or show how Tulane and Tulsa match up statistically:
Tulane Offense vs. Tulsa Defense
Offense | Defense | Edge | |
| Rush Success | 87 | 83 | |
| Line Yards | 79 | 90 | |
| Pass Success | 27 | 18 | |
| Pass Blocking** | 29 | 86 | |
| Havoc | 36 | 108 | |
| Finishing Drives | 56 | 115 | |
| ** Pass Blocking (Off.) vs. Pass Rush (Def.) | |||
Tulsa Offense vs. Tulane Defense
Offense | Defense | Edge | |
| Rush Success | 57 | 36 | |
| Line Yards | 61 | 81 | |
| Pass Success | 63 | 60 | |
| Pass Blocking** | 111 | 90 | |
| Havoc | 109 | 92 | |
| Finishing Drives | 10 | 54 | |
| ** Pass Blocking (Off.) vs. Pass Rush (Def.) | |||
Pace of Play / Other
| PFF Tackling | 39 | 101 |
| PFF Coverage | 7 | 24 |
| SP+ Special Teams | 83 | 102 |
| Seconds per Play | 27.1 (85) | 25.0 (34) |
| Rush Rate | 57.9% (37) | 51.0% (77) |
Data via CollegeFootballData.com (CFBD), FootballOutsiders, SP+, Pro Football Focus and SportSource Analytics.
Tulane vs Tulsa Betting Pick
As of writing, Tulane is favored by 7.5 points after opening at 7. The public appears to be backing the favorite with 63% of tickets on Tulane and just 39% of the money. Sharps have also favored the over with 51% of the money compared to just 26% of the tickets.
Tulsa's offensive strengths play right into the hands of the Green Wave defense. If Tulsa is unable to create explosive plays, the team will struggle to keep up with Tulane's consistent attack, particularly with the Golden Hurricane's inability to get opponents off of the field.
My preferred play is to lay the points with Tulane, and I would play this as high as 9.5.
Pick: Tulane -7.5 ⋅ Play to -9.5 |


