Tulsa vs. Tulane Odds
| Tulsa Odds | ||
|---|---|---|
| Spread | Total | Moneyline |
-3 -105 | 55 -110o / -110u | -145 |
| Tulane Odds | ||
|---|---|---|
| Spread | Total | Moneyline |
+3 -115 | 55 -110o / -110u | +125 |
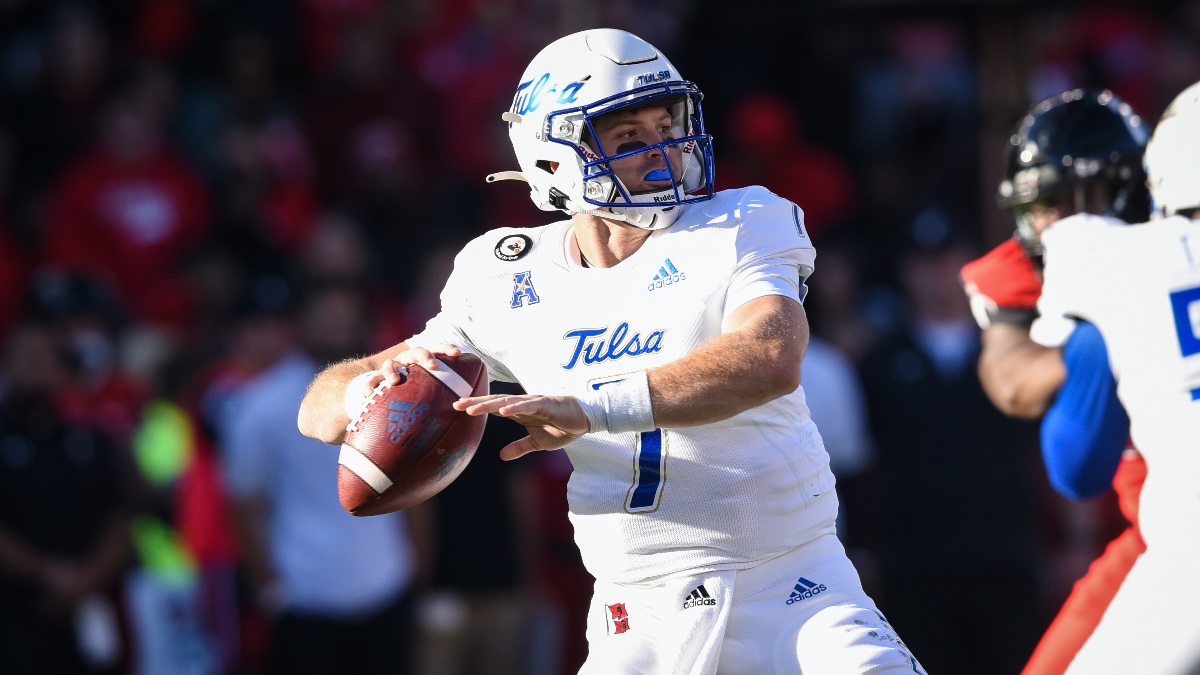
There's nothing better than a late-season Group of Five matchup featuring teams with a combined four wins.
Tulsa has a 3-6 record and enters this contest on a two-game losing streak. Tulane has a 1-8 mark and has lost every game against FBS opponents this year.
Tulsa enters this weekend following a closer than expected game against Cincinnati. It has a 4-5 record against the spread and has gone over in five games this season.
Tulane lost a close game to Central Florida last week, but covered the two-touchdown spread. The Green Wave are 4-5 ATS and have gone over in six games this season.
It will be windy at the kickoff of this game, as well. Winds will range from 11-14 miles per hour, but otherwise, the weather will be clear and warm.
Tulsa Offense
The Golden Hurricane offense has scored 23.9 points per game and averages 6.1 yards per play. They're averaging 24.9 seconds per play and 71.3 offensive plays per game. They have a 40.5% Success Rate and are averaging 3.14 points per opportunity.
One struggle for the offense has been that it allows a 20.8% Havoc rate.
Davis Brin has led the Tulsa passing game. He's thrown for 2,228 yards and 12 touchdowns, but he's also given the ball away 11 times via interception. Brin is completing 58.5% of his passes for an average of 7.9 yards per attempt.
Tulsa has a 39.4% Passing Success Rate and has averaged 3.2 passes over 20 yards per game.
The Golden Hurricane offense leans heavily on the running game. They've averaged 40 rush attempts per game and 190.1 yards per game.
Shamari Brooks has been their lead back with 720 yards on 5.0 yards per carry. As a team, they have a 41.4% Rushing Success Rate despite the fact that they're only generating 2.74 Line Yards per attempt.
Tulsa Defense
Tulsa is allowing 30.6 points per game, which ranks 100th nationally and 5.7 yards per play. The team has allowed a 40.9% Success Rate and concede 4.2 points per opportunity.
One positive for this defense is its 18.4% Havoc rate.
Opposing quarterbacks are completing 60.8% of their passes for an average of 8.15 yards per attempt. They allow a 37.6% Passing Success Rate and have allowed an average of 3.33 20+ yard passes per game. They have defended 25 passes and have forced seven interceptions.
Tulsa is allowing 157.2 rushing yards per game at an average of 4.0 yards per attempt. They allow a 43.3% Rushing Success Rate.
The defensive line is the strength, as it has held opponents to just 2.87 Line Yards per attempt and forced a 20.4% stuff rate.
Tulane Offense
The Tulane offense plays with a decent amount of pace, but inconsistent efficiency. The Green Wave are averaging 24.3 seconds per play and 69.2 offensive plays per game. They have scored 27.2 points per game and conceded an average of 5.4 yards per play.
Their 35.9% Success Rate is at the center of their struggles, but when they've gotten chances to score, they've averaged 4.24 points per opportunity.
Michael Pratt returned from injury against Central Florida. While his return performance was a bit of a struggle, he's been the centerpiece of the Green Wave offense. He's completing 59.3% of his passes for 7.3 yards per attempt. He's thrown for 16 touchdowns, but has five interceptions as well.
And while he's only averaging 1.1 yards per attempt, he has four rushing touchdowns. As a team, Tulane has a 33% Passing Success Rate and has averaged 3.1 20+ yard passes per game.
Tulane is averaging 37.3 rush attempts per game and 150.4 rushing yards per game. Cameron Carroll and Tyjae Spears have split the running back workload and both are averaging more than five yards per carry.
As a team, Tulane has a 39% Rushing Success Rate. Their line has created just 2.95 Line Yards per attempt and has allowed a 19.9% stuff rate.
Tulane Defense
While the Tulane offense has struggled, it's the defense that has really let it down. The Green Wave rank 125th in scoring defense, with 37.9 points allowed per game and 6.3 yards per play (22nd worst). They allow a 40.0% Success rate and 3.85 points per opportunity.
The Green Wave rank in the bottom 10 of passing defense. They allow 284.1 passing yards per game and opposing quarterbacks have completed 68.2% of passes. They've allowed a 38.2% Passing Success Rate and allow 4.2 20+ yard passes per game. They have defended 19 passes and forced six interceptions.
The rushing defense is slightly better, allowing 170.7 yards per game at an average of 4.3 yards per rush. It has a 41.8% Rushing Success Rate.
The defensive line is the biggest strength of the defense, as it has forced a 23.1% stuff rate and held opposing offensive lines to 2.83 Line Yards per attempt.
Tulsa vs. Tulane Matchup Analysis
Toggle the dropdowns below to hide or show how Tulsa and Tulane match up statistically:
Tulsa Offense vs. Tulane Defense
Offense | Defense | Edge | |
| Rush Success | 115 | 56 | |
| Line Yards | 115 | 38 | |
| Pass Success | 101 | 84 | |
| Pass Blocking** | 64 | 93 | |
| Big Play | 53 | 122 | |
| Havoc | 80 | 96 | |
| Finishing Drives | 113 | 76 | |
| ** Pass Blocking (Off.) vs. Pass Rush (Def.) | |||
Tulane Offense vs. Tulsa Defense
Offense | Defense | Edge | |
| Rush Success | 61 | 70 | |
| Line Yards | 88 | 46 | |
| Pass Success | 103 | 80 | |
| Pass Blocking** | 84 | 31 | |
| Big Play | 46 | 84 | |
| Havoc | 115 | 70 | |
| Finishing Drives | 40 | 107 | |
| ** Pass Blocking (Off.) vs. Pass Rush (Def.) | |||
Pace of Play / Other
| PFF Tackling | 14 | 83 |
| Coverage | 95 | 96 |
| Middle 8 | 18 | 69 |
| SP+ Special Teams | 51 | 111 |
| Plays per Minute | 40 | 23 |
| Rush Rate | 55.9% (57) | 53.9% (69) |
Data via College Football Data, FootballOutsiders, SP+, PFF and SportSource Analytics.
Despite both defenses struggling this season, they hold some advantages over the offenses. However, the most notable advantage is Tulane's offense having an edge in rushing success rate and finishing drives.
Tulsa vs. Tulane Betting Pick
The betting marking is fairly split on this matchup. The money is currently sitting at a 54-46% split favoring Tulsa and the tickets are only slightly more defined with Tulsa at 58 percent.
According to the Action Network PRO Report, the sharp action and model projection favor the Green Wave.
On the total side, the sharps favor the under, which has pushed the line down from its open. My preferred play remains on the under.
While both of these teams are capable of playing with some pace, they both prefer to run the ball. That will keep the clock moving, particularly with both defenses being strong against the run.


