What is the most important ranking or rating in college football today? Forget about the College Football Playoff selection committee’s rankings — those are so predictable. They always just pick the undefeated teams. Wait, what? Nevermind.
The Nielsen Ratings are the most intriguing college football rankings. They provide a glimpse into which programs attract the most eyeballs (advertising revenue) and which schools might have the most value to conferences looking to expand.
So, who was the most-watched, most-valued, most-popular team in 2023? Before we get to that, the not-so fine print: not every network is rated by Nielsen.
Those that are rated: ABC, CBS, FOX, NBC, ESPN, ESPN2, ESPNU, Big Ten Network and the CW. The networks not Nielsen rated: the ACC Network, Pac-12 Network, SEC Network, CBS Sports Network, ESPN+ and Peacock.
Why does that matter? It means that the Nielsen ratings for the ACC, Pac-12 and SEC schools will be higher than other leagues since their lower-profile games on their own networks are not included and won’t bring down their per-game averages.
So, for any not-so-compelling (i.e. bad) matchups that were relegated to the ACC, Pac-12 or SEC Networks, those schools were not penalized for the low viewing numbers compared to the Big Ten schools, since the Big Ten Network is Nielsen-rated.
In other words, when there's a small audience watching Vanderbilt vs. (fill in the blank) on the SEC Network, that doesn’t bring down an SEC school’s per-game averages since those low numbers are not Nielsen-rated.
So, now that we know this is an inexact science and all leagues are not monitored equally, here we go:
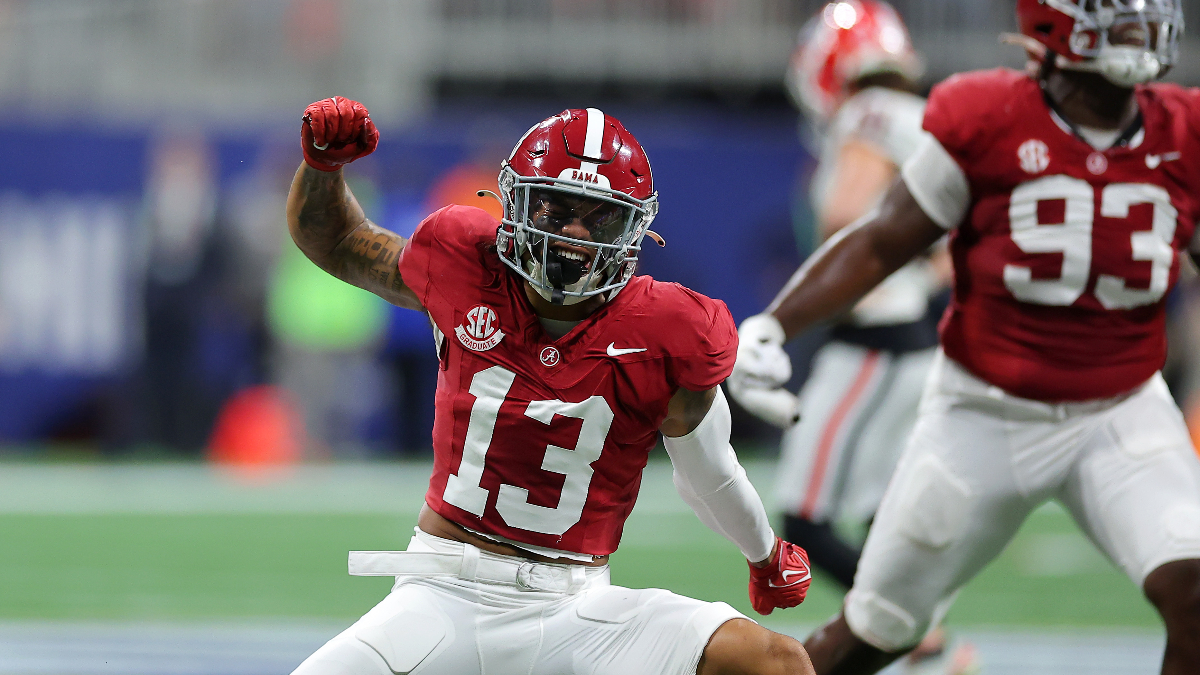
America’s (TV) Team in 2023 was the Alabama Crimson Tide. Alabama had 11 of its 13 games on Nielsen-rated networks and averaged 7.12 million viewers per game.
Ohio State was second (averaged 6.05 million viewers), followed by Colorado (six million viewers). Among the 16 most-watched teams, the 4-8 Buffaloes were the only one that finished with a losing record. Hang the banner, Buffs!
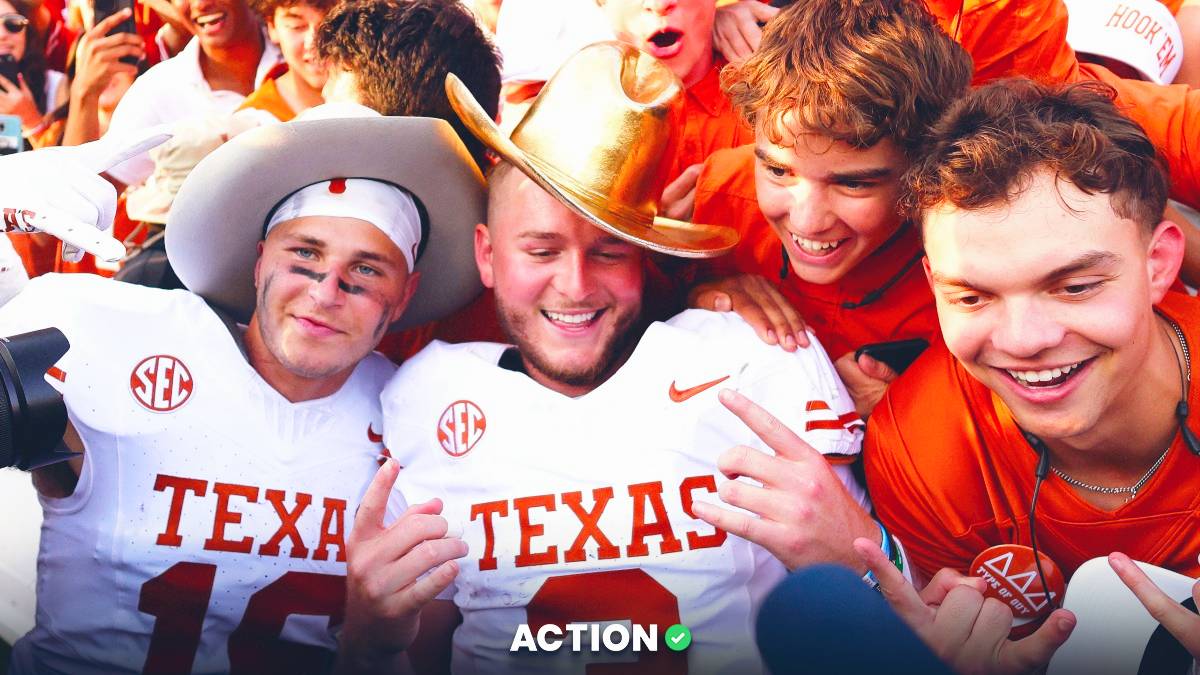
For all the conspiracy folks out there — and I know you’re out there based on my Twitter feed (thanks for following, by the way) — three of the four teams that made the playoff were among the eight most popular Nielsen-rated teams this year: No. 1 Alabama, No. 5 Michigan and No. 8 Texas. Undefeated Pac-12 champion Washington was No. 11.
Before we list the top Nielsen-rated teams, a shoutout to Sports Media Watch, which posts the Nielsen ratings each week.
Here are the top 32 most-watched teams, based on a minimum of five Nielsen-rated games. All 32 teams averaged more than two million viewers per game.
Average viewers by million (Nielsen rated games)
- Alabama 7.12 (11)
- Ohio State 6.05 (11)
- Colorado 6.00 (9)
- Georgia 5.90 (11)
- Michigan 5.61 (12)
- Tennessee 4.57 (7)
- Oregon 4.43 (10)
- Texas 4.26 (12)
- Florida State 4.16 (12)
- Notre Dame 4.15 (10)
- Washington 4.14 (10)
- LSU 3.79 (9)
- USC 3.77 (9)
- Penn State 3.66 (11)
- Auburn 3.55 (7)
- Missouri 3.25 (6)
- Florida 3.17 (8)
- Ole Miss 2.93 (7)
- Clemson 2.90 (7)
- Texas A&M 2.74 (9)
- Iowa 2.68 (11)
- Miami 2.65(6)
- Duke 2.639 (6)
- Nebraska 2.637 (11)
- Utah 2.616 (7)
- Oklahoma 2.6153 (11)
- Navy 2.6152 (5)
- Oregon State 2.44 (8)
- Louisville 2.37 (10)
- Washington State 2.15 (6)
- Kentucky 2.07 (6)
- Mississippi State 2.01 (5)
Some Random Ramblings
Just win, baby: Only seven of the top 32 viewed teams by Nielsen’s ratings finished with a losing record: No. 3 Colorado, No. 17 Florida, No. 20 Texas A&M, No. 24 Nebraska, No. 27 Navy, No. 30 Washington State and No. 32 Mississippi State.
Poor, poor Hawaii: The Rainbow Warriors played 13 games this season, but no one saw them outside the stadium — at least based on Nielsen’s ratings.
Hawaii played on the SEC Network, Pac-12 Network, twice on CBS Sports Network and the remaining nine games were on Spectrum Sports Pay-Per-View. None of those are rated by Nielsen.
The SEC Network — It Just Means More (Appearances for Vanderbilt): Without the SEC Network, you probably have never seen a Vanderbilt game. In the past two years, the Commodores have played exactly one out of 24 games on a Nielsen-rated network. That was this year on CBS against No. 1 Georgia, which averaged 2.46 million viewers.
Nine of Vanderbilt’s games this season were relegated to the SEC Network. The Commodores should be the SEC Network’s poster boy, alongside Peter Burns, of course. Love ya, Peter!
Army beats Navy … again: Army had only three games on Nielsen-rated networks but edged Navy in average viewers — 2.73 million to 2.61 million. Navy finished 27th nationally, however, with a schedule bookended by games against Notre Dame and Army.
Ram tough: Colorado State had the best per-game Nielsen average for Group of Five teams at 4.8 million, but that was for only two games. The biggie for CSU, of course, was 9.3 million vs. Colorado.
The most-watched Group of Five teams (minimum five Nielsen-rated games):
Most-watched teams on Nielsen-rated games, followed by their highest-rated game.
- Navy 2.61 million (5): 7.18 million vs. Army
- USF 927,000 (6): 4.84 million vs. Alabama
- Tulane 640,000 (12): 1.72 million vs. Memphis
- Boise State 590,000 (9): 1.97 million vs. Washington
- Memphis 576,000 (7): 1.72 million vs. Tulane
- Rice 541,000 (7): 3.21 million vs. Texas
Power 5 Breakdown (per game)
Here are the average Nielsen viewers for the Power 5 schools that averaged at least a million viewers per game. (Not all teams played the same number of games on Nielsen-rated networks.)
ACC: Florida State 4.16, Clemson 2.90, Miami 2.65, Duke 2.63, Louisville 2.37, North Carolina 1.93, Georgia Tech 1.83, Boston College 1.48, Pitt 1.37, Syracuse 1.20, NC State 1.13, Virginia Tech 1.02. Others: Virginia, Wake Forest.
Big 12: Texas 4.26, Oklahoma 2.61, Oklahoma State 1.96, TCU 1.70, Kansas 1.48, West Virginia 1.45, Iowa State 1.37, BYU 1.31, Kansas State 1.30, Texas Tech 1.30, Baylor 1.09. Others: Cincinnati, Houston, UCF.
Big Ten: Ohio State 6.05, Michigan 5.61, Penn State 3.66, Iowa 2.68, Nebraska 2.63, Michigan State 1.65, Wisconsin 1.61, Maryland 1.55, Minnesota 1.44, Indiana 1.26, Rutgers 1.14. Others: Illinois, Northwestern, Purdue.
Pac-12: Colorado 6.00, Oregon 4.43, Washington 4.14, USC 3.77, Utah 2.61, Oregon State 2.44, Washington State 2.15, UCLA 1.67, Stanford 1.64, Arizona 1.30, Arizona State 1.20, Cal 1.08.
SEC: Alabama 7.12, Georgia 5.90, Tennessee 4.57, LSU 3.79, Auburn 3.55, Missouri 3.25, Florida 3.17, Ole Miss 2.93, Texas A&M 2.74, South Carolina 2.69, Vanderbilt 2.46, Kentucky 2.07, Mississippi State 2.01, Arkansas 1.93.
Independent: Notre Dame 4.15.


