We’ve made it to yet another glorious weekend of college football.
However, don’t run to the counter just yet. Make sure you read this article to make some informed decisions on where to place your money this weekend based on college football’s most important advanced stats.
This breakdown looks at three metrics that have been found to be relevant to covering the spread:
If you are interested in why these metrics have been chosen, check out this piece by Collin Wilson. To quote his findings:
“Data from the past five years indicates defensive Success Rate, Havoc and Finishing Drives are the biggest indicators in beating oddsmakers this college football season.”
Let’s dive in and see where we can find an edge in Week 2.
Havoc
What is Havoc?
Havoc is a college football term defined as a play where there’s an unexpected outcome.
Pass breakups, forced fumbles and tackles for loss are just a few of the plays that cause chaos on any given Saturday. Collectively, these plays are used to build an identity for a team.
The calculation for Havoc is simply a cumulative number of tackles for loss, interceptions, fumbles and passes defensed divided by the number of plays on both sides of the ball.
Let's dive in and see where we can find some big Havoc discrepancies in Week 2.
Note: Keep in mind that these are still 2021 season ranks. We will update to 2022 after this week.
Home Team Havoc Allowed vs. Away Team Havoc Rate
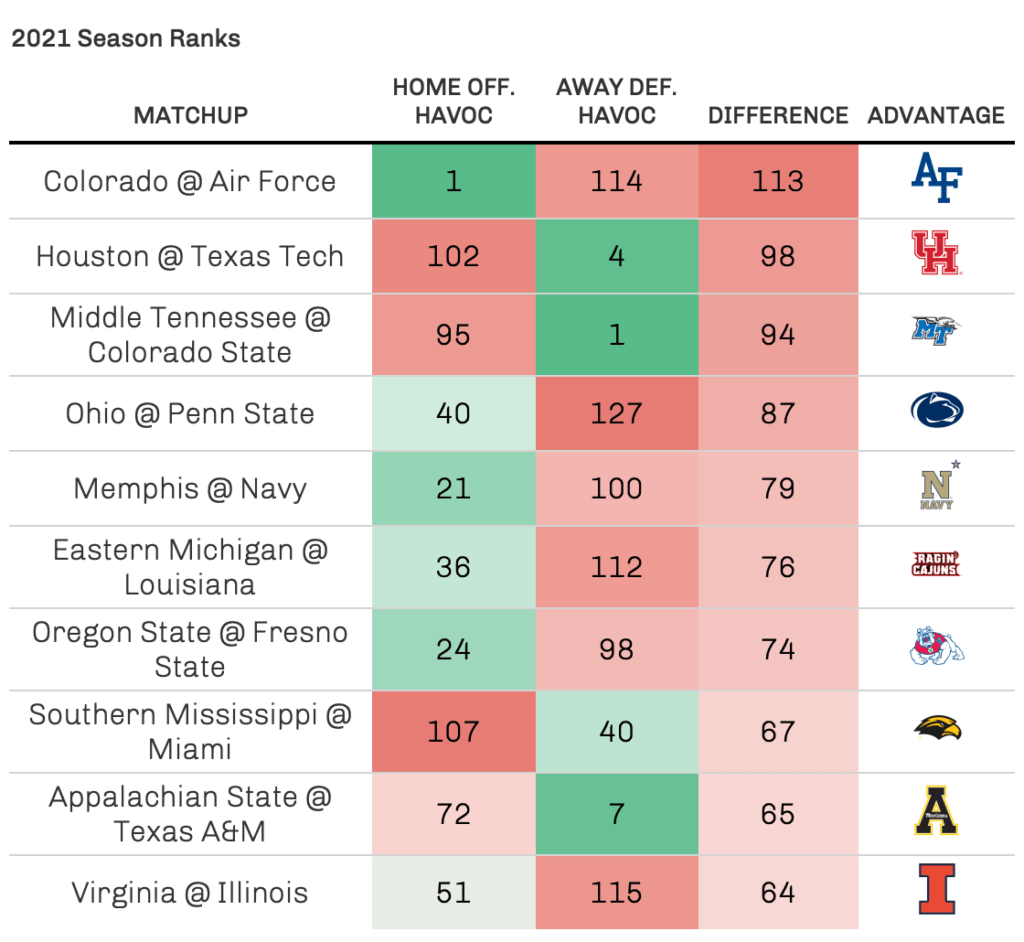 |
Biggest Mismatches
- Air Force Offense vs. Colorado Defense
- Houston Defense vs. Texas Tech Offense
- Middle Tennessee Defense vs. Colorado State Offense
Away Team Havoc Allowed vs. Home Team Havoc Rate
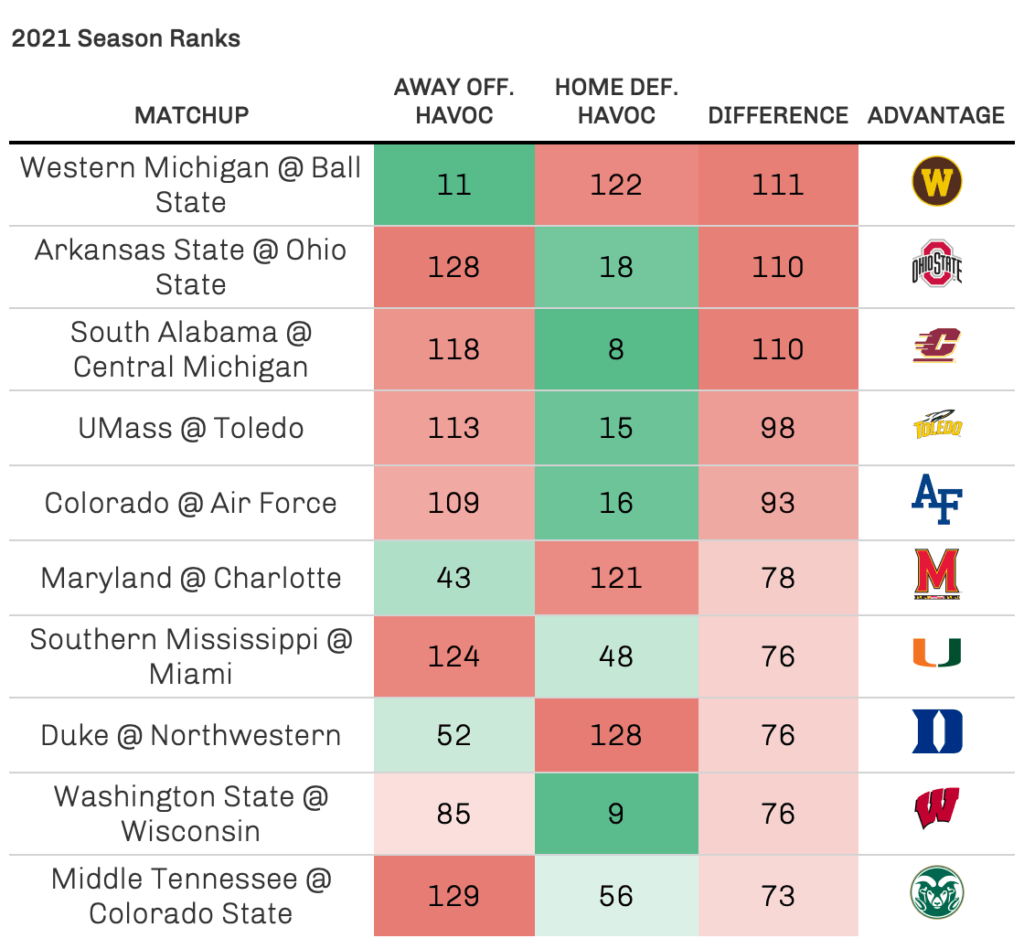 |
Biggest Mismatches
- Western Michigan Offense vs. Ball State Defense
- Ohio State Defense vs. Arkansas State Offense
- Central Michigan Defense vs. South Alabama Offense
Air Force appears to have a favorable mismatch on both sides of the ball.
It makes sense that a triple-option team would rank first in Havoc allowed rate simply due to their style of play, but the Falcons defense's havoc generation is particularly noteworthy.
Finishing Drives
What is Finishing Drives?
Finishing Drivesis points per opportunity when the offense passes its opponent’s 40-yard line.
Defensively, this is how many points per opportunity a defense allows when the opposing offense crosses the 40-yard line.
For example, take last week's Chick-fil-A kickoff game between Oregon and Georgia:
Georgia crossed the 40-yard line seven times and scored 49 points. This translates to 7.0 points per opportunity.
Home Team Offensive Points per Opportunity vs. Away Team Defensive Points per Opportunity
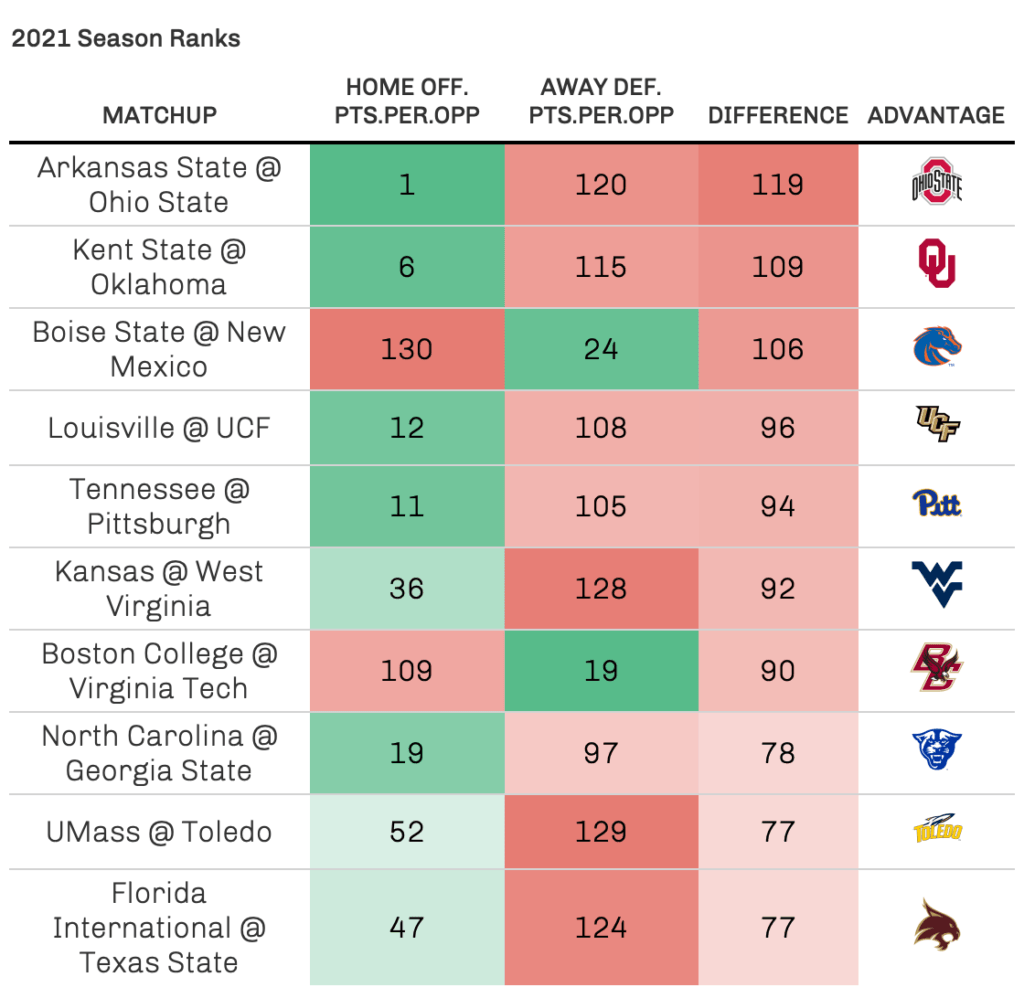 |
Biggest Mismatches
- Ohio State Offense vs. Arkansas State Defense
- Oklahoma Offense vs. Kent State Defense
- Boise State Defense vs. New Mexico Offense
Away Team Offensive Points per Opportunity vs. Home Team Defensive Points per Opportunity
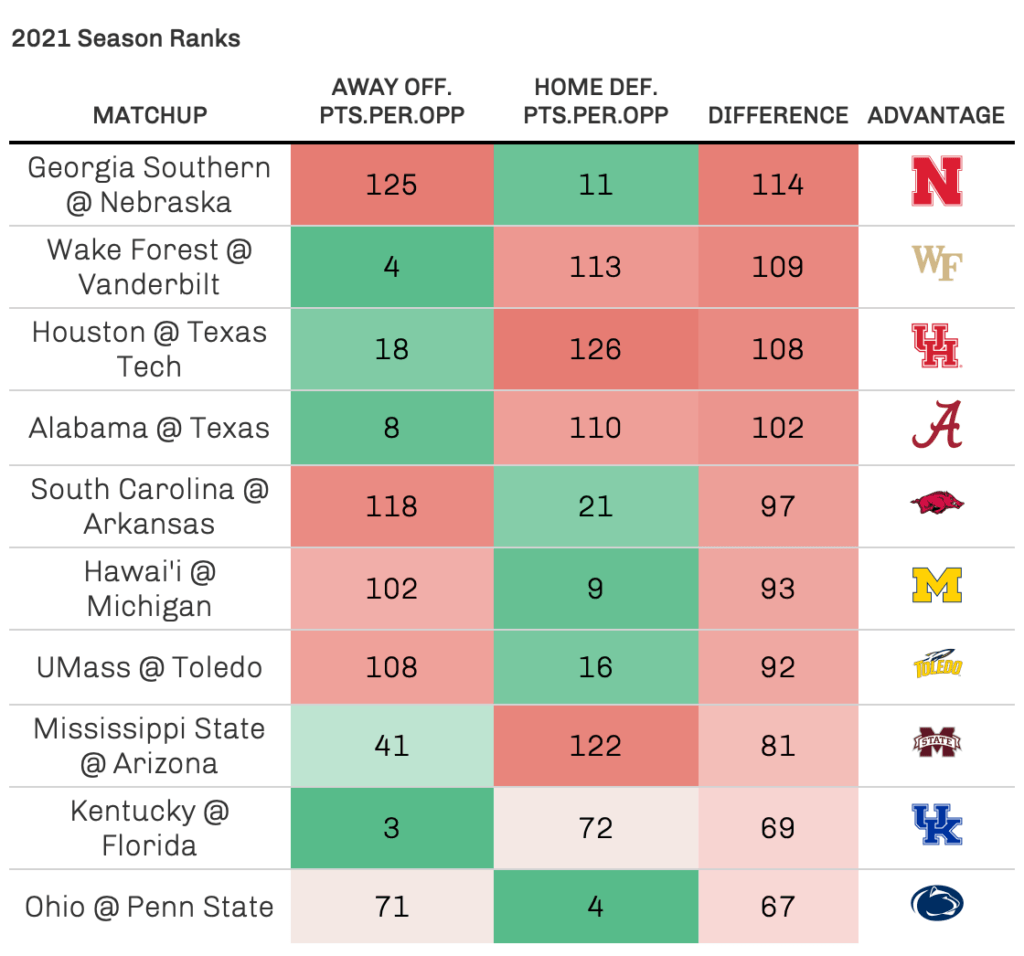 |
Biggest Mismatches
- Nebraska Defense vs. Georgia Southern Offense
- Wake Forest Offense vs. Vanderbilt Defense
- Houston Defense vs. Texas Tech Offense
Success Rate
What is Success Rate?
Success Rate is an advanced metric in football that measures efficiency, but with the important context of down and distance considered.
A play is defined as successful if:
- It gains at least 50% of the yards required to move the chains on first down
- 70% of yards to gain on second down
- 100% of yards to gain on third or fourth down
To calculate Success Rate, simply divide the number of successful plays (as defined by down and distance above) by total plays.
This definition is straight from our article on Success Rate.
Home Team Offensive Success Rate vs. Away Team Defensive Success Rate
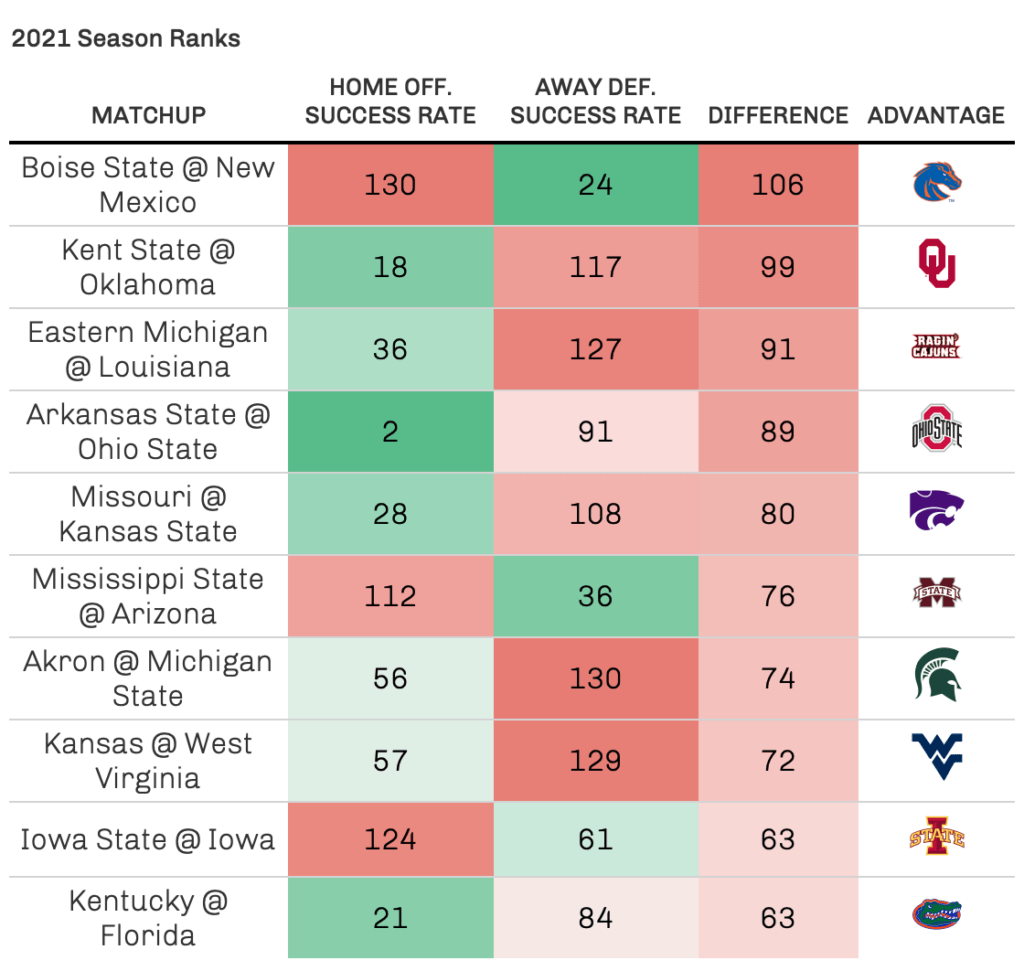 |
Biggest Mismatches
- Boise State Defense vs. New Mexico Offense
- Oklahoma Offense vs. Kent State Defense
- Louisiana Offense vs. Eastern Michigan Defense
Away Team Offensive Success Rate vs. Home Team Defensive Success Rate
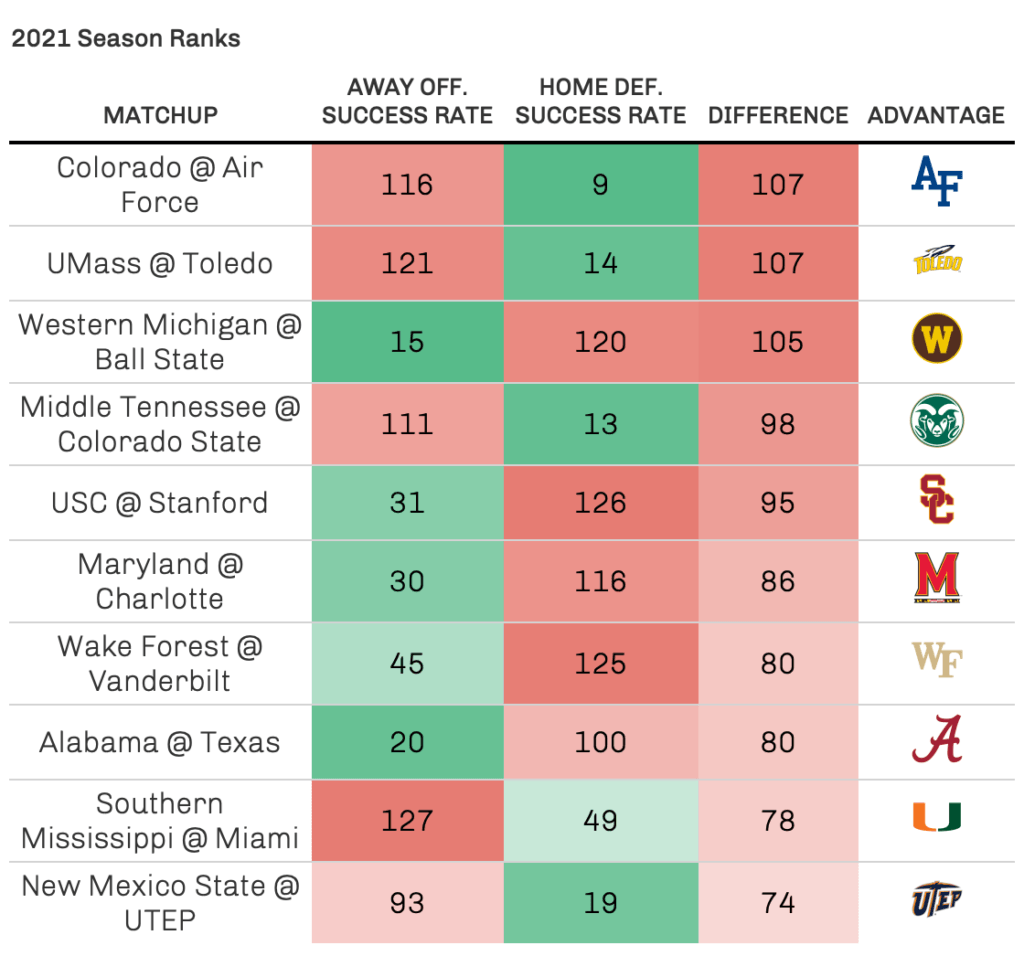 |
Biggest Mismatches
- Air Force Defense vs. Colorado Offense
- Toledo Defense vs. UMass Offense
- Western Michigan Offense vs. Ball State Defense
CFB Week 2 Betting Takeaways
Congratulations on finishing this article (it can be a little dense), but now that you’re here, hopefully I can provide some insight on what is most actionable based on all of this data.
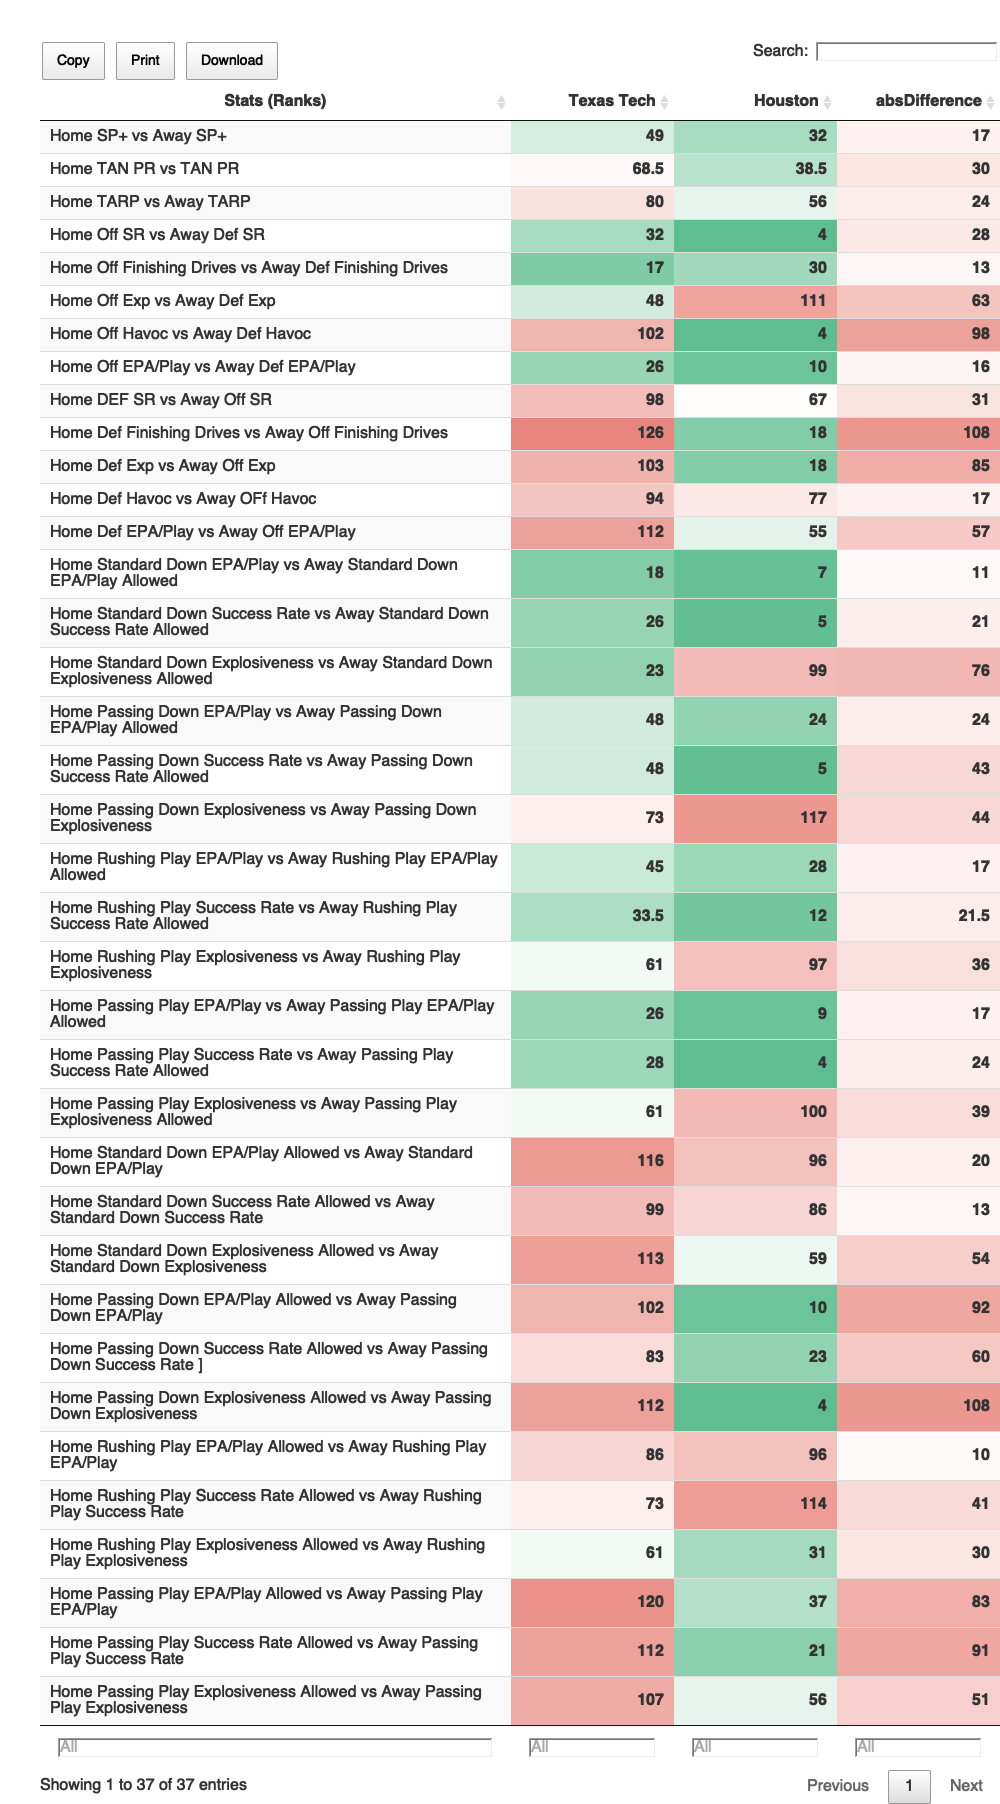
There is one game that, in my opinion, stands out from the rest: Houston vs. Texas Tech.
Houston vs. Texas Tech is projected to be a high-scoring affair with a total of 63. However, that total has come down from a high of 66 earlier this week.
This seems to be a great situational spot, because both teams are coming off Week 1 games in which they cleared their respective game totals by 10 or more points.
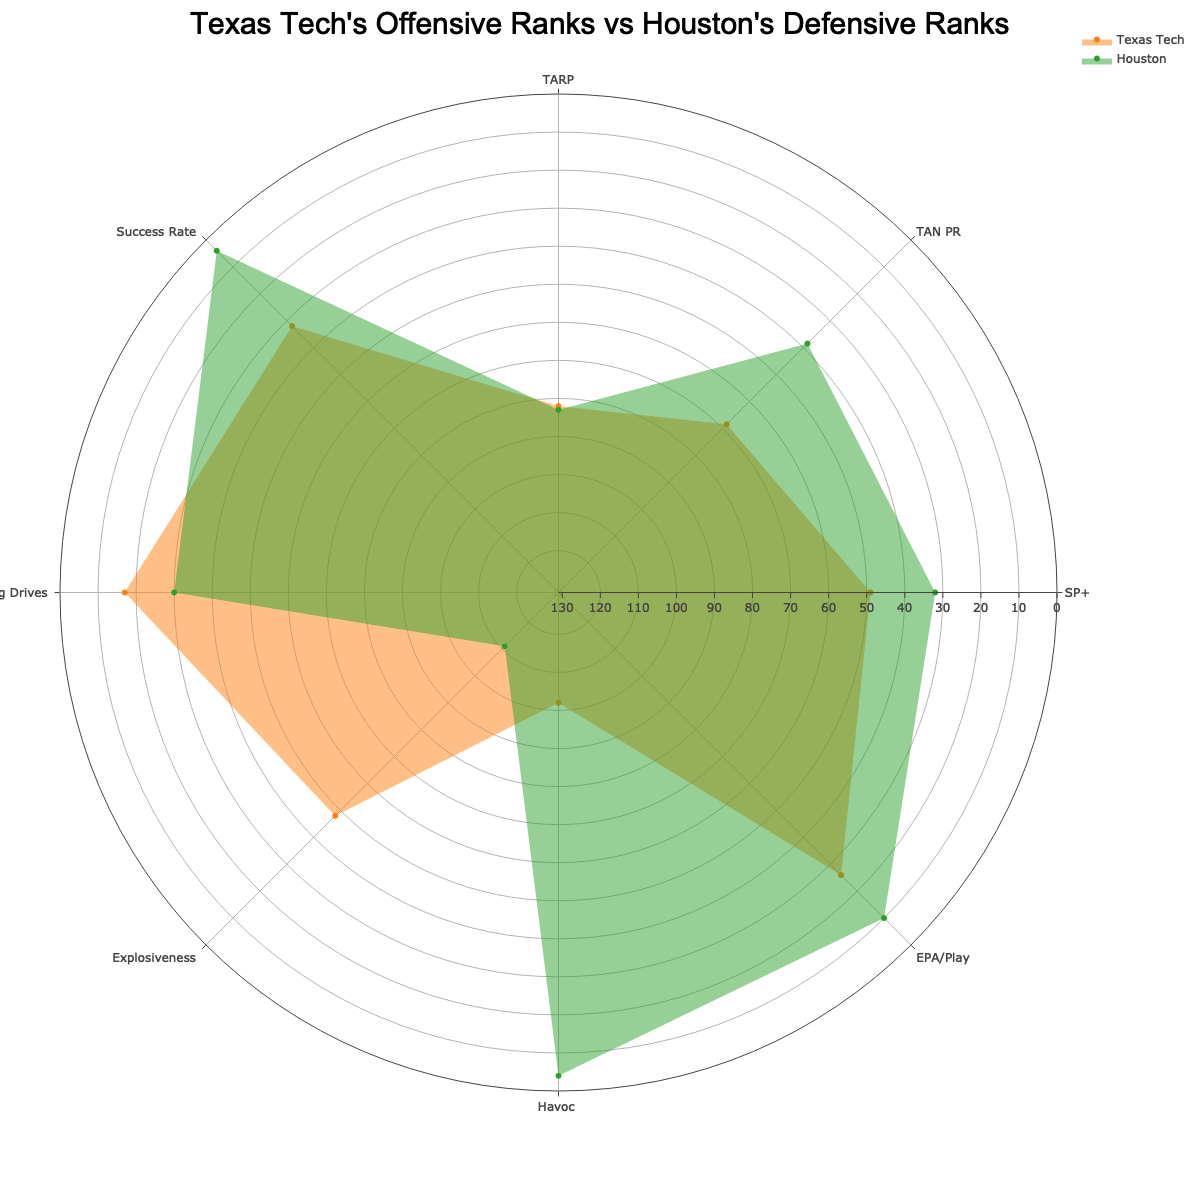
Let's take a look at the advanced metrics for this game only:
 |
 |
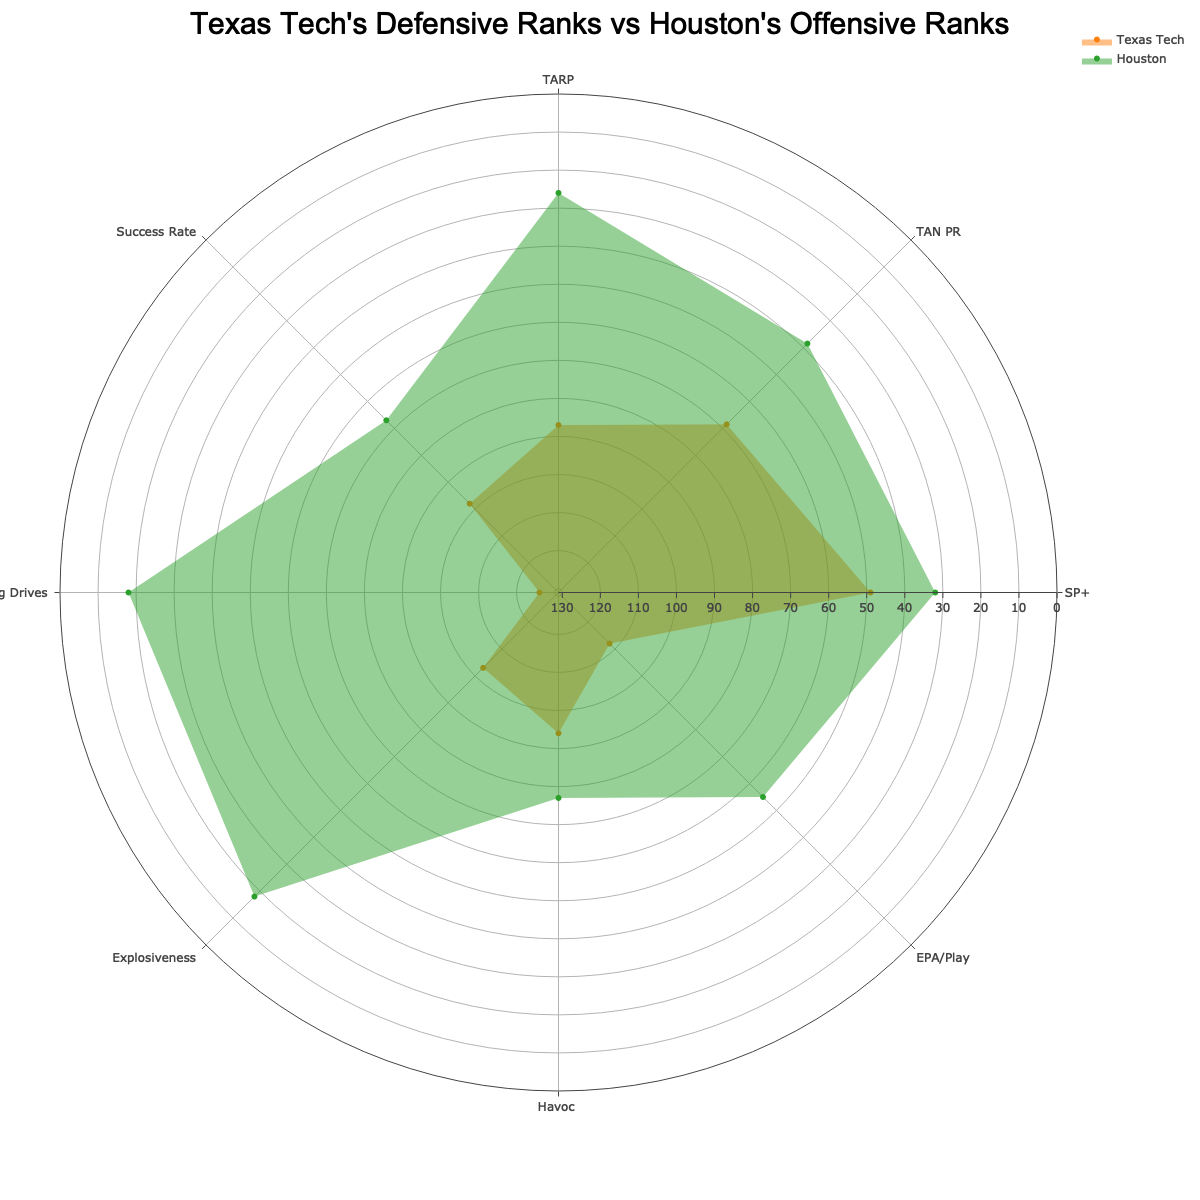 |
In particular, take a look at the second chart: You'll notice that Houston's defense is ranked higher than Texas Tech's offense in success rate, havoc, and EPA per play.
Houston generated 10 havoc plays in Week 1 and held UTSA to 3.7 points per possession. I'm looking at Houston's defense to bounce back in a big way this weekend and set the tone for the rest of the season.


