For those unfamiliar with Pythagorean expectation, it's a formula that calculates an expected win percentage based on point differential.
As the average margin of victory increases, so does the Pythagorean expectation. It was originally created by Bill James to be used in baseball but can be used in football as well. It gives us some information about which teams may have been lucky in that regard and which teams may see positive regression in the next season.
Take Texas A&M and Cincinnati, for example.
Both teams went 9-1 last season but had a relatively wide gap between one another in expected wins. Cincinnati had an average point differential of nearly three touchdowns, and A&M came in at 10.9.
Cincinnati was right on par with its expected win total of 8.9. A&M overperformed from this perspective, however. An average point differential of 10.9 gives it about 7.5 expected wins, which was well below the Aggies' nine-win total.
Despite identical records, Cincinnati handled its opponents much better than Texas A&M.
Keep in mind that some of these teams played just three or four games, so their smaller sample sizes will have less significance than those that played an entire schedule. Smaller samples mean higher variance and can be abnormally impacted by the result of just one game.
In the chart below, the teams on the right side of the reference line outperformed their expected wins. Vice versa on the left side.
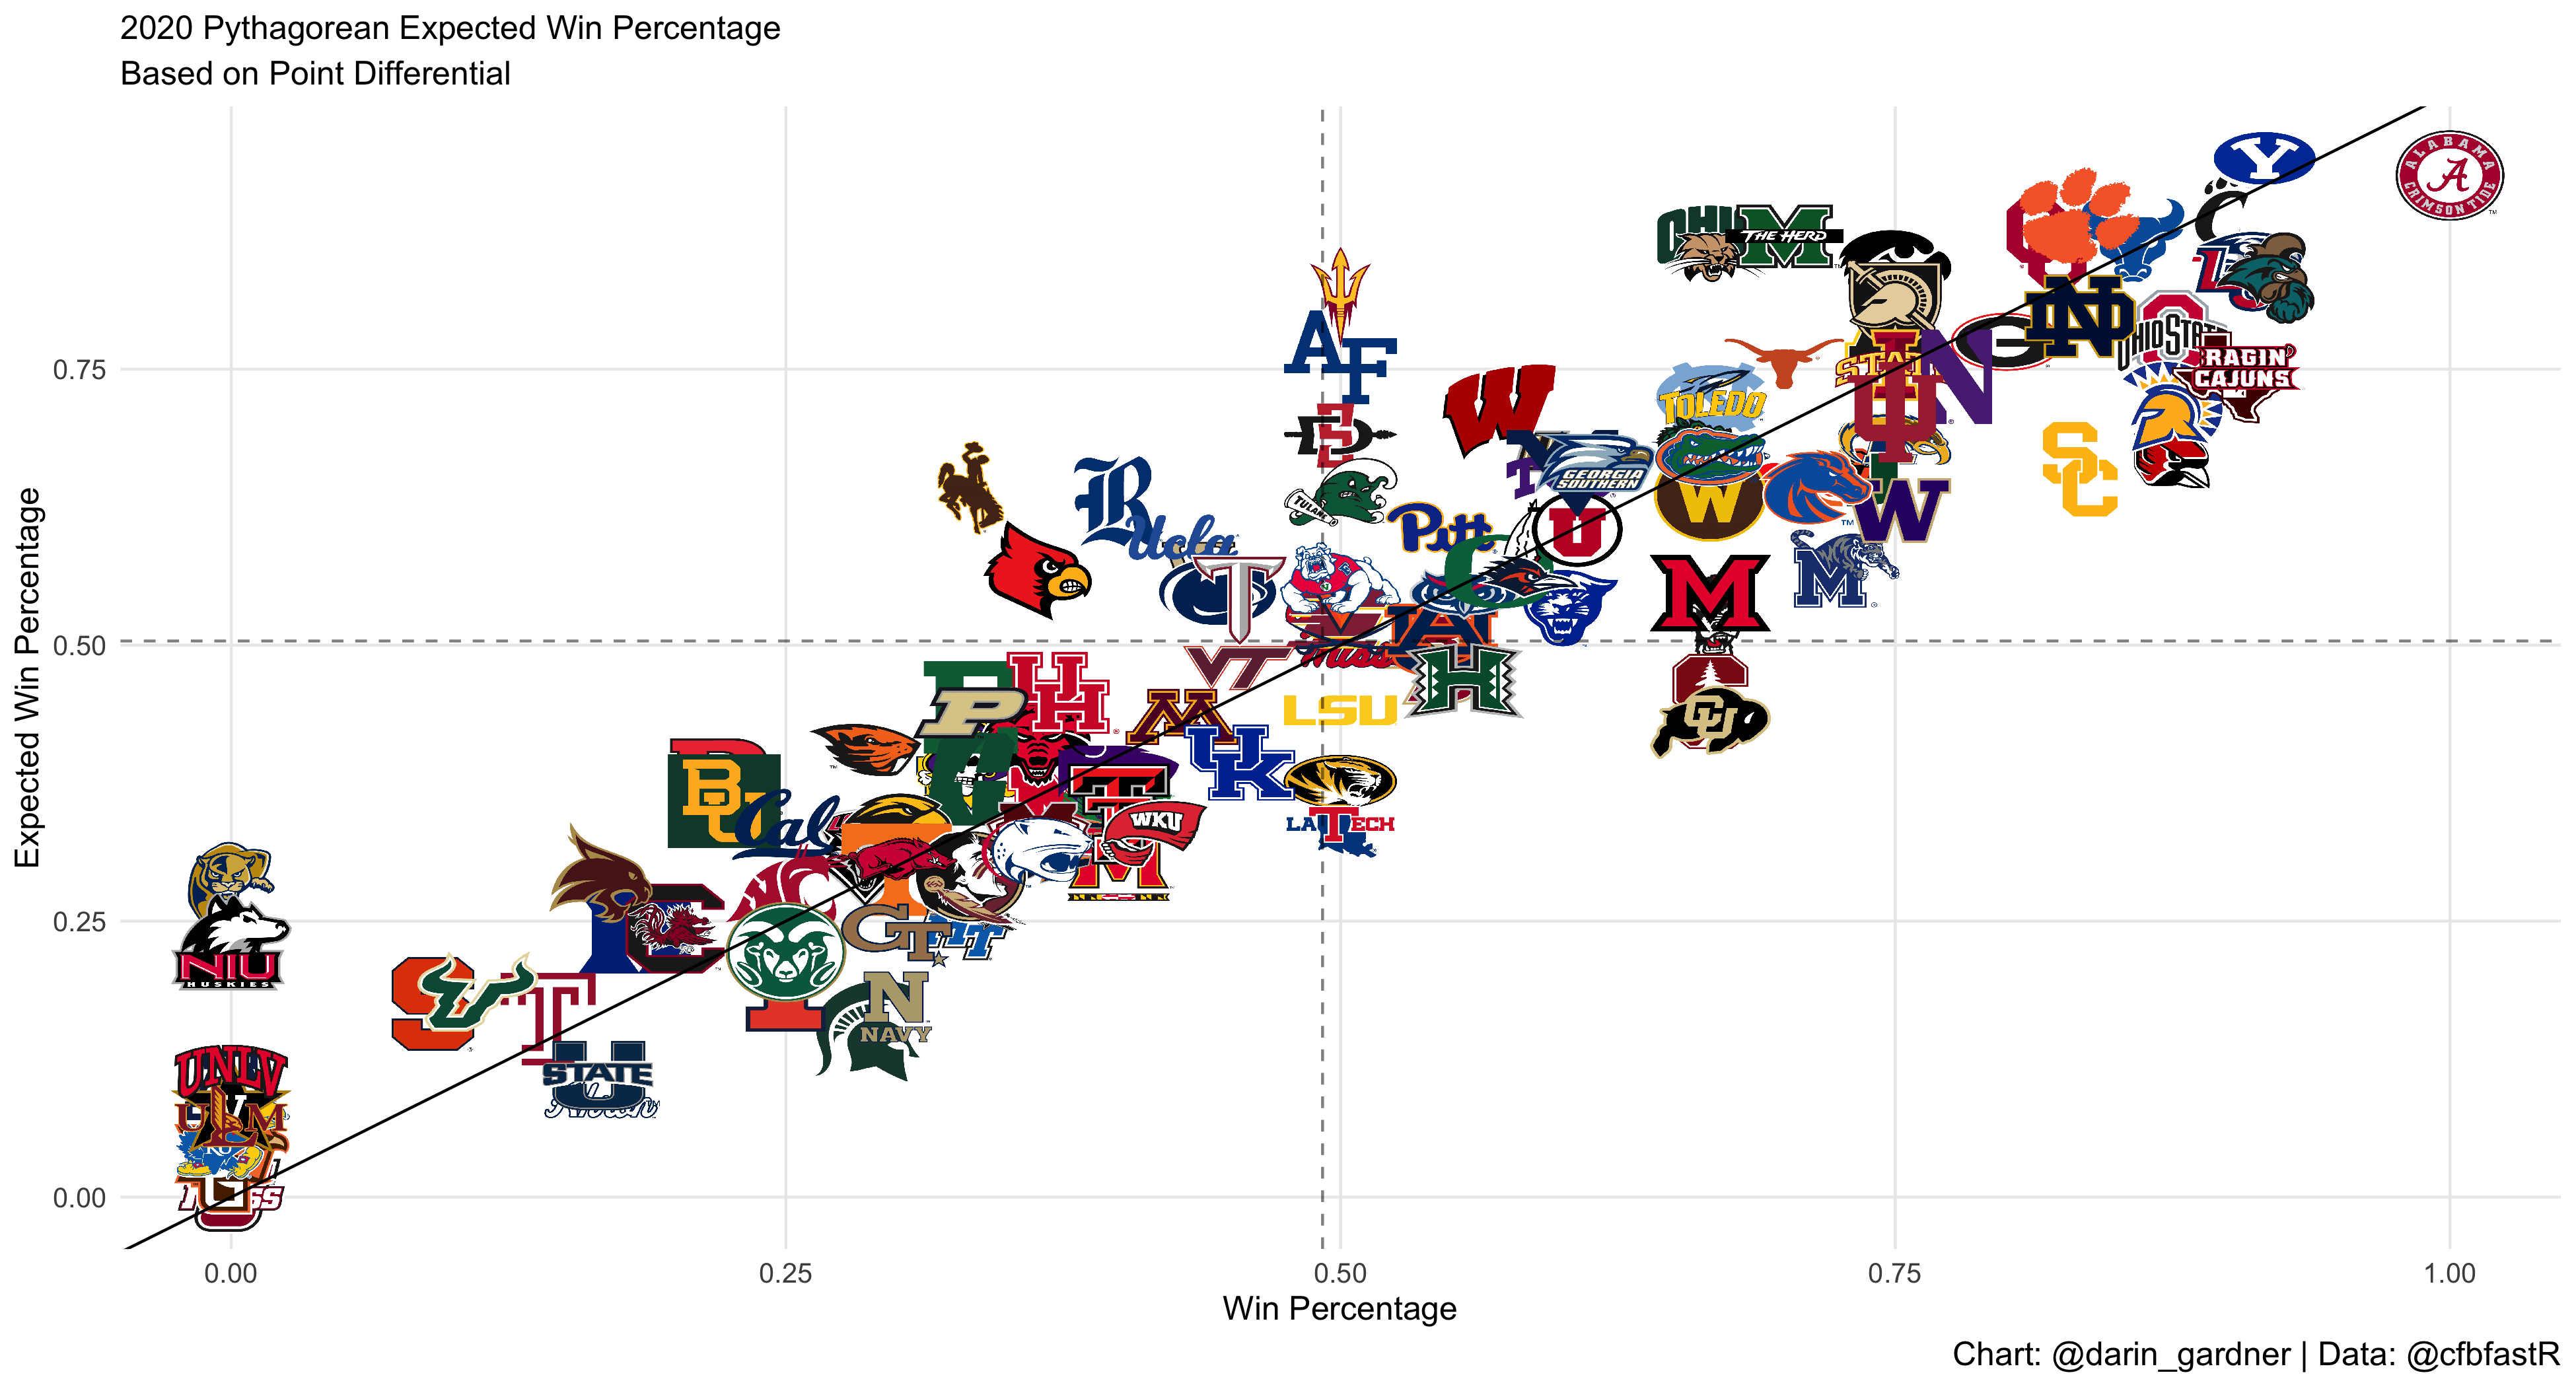
You can see here how the shortened season can impact these results.
The top four and bottom four in this metric both played single-digit games, which makes sense, because of the added variance we get from a smaller sample. One blowout for or against the team can really impact the results with a small number of games.
We start off with two Pac-12 teams that each played six-game schedules with Colorado and Stanford. According to this metric, these were the two luckiest teams in the nation in 2020.
Each team went 4-2 in their shortened seasons, but they boasted point differentials of -19 and -14, respectively. According to this formula, Colorado’s expected wins were about 2.58, while Stanford sat at 2.69.
The conference runner-up, USC, also played a six-game season, going 5-0 before a loss to Oregon in the Pac-12 Championship. USC still had a solid average point differential of just over a touchdown per game, but the Trojans played much more like a 4-2 team than a 5-1 team. Three of their five victories came by five points or less, which probably isn’t repeatable.
Two Group of Five conference champions appeared in the top 10 in Ball State and San Jose State. They had similar seasons, each going 7-1 with an average margin of victory just above eight points. A 7-1 record had them each about 1.5 wins above expected.
Looking at teams with larger samples, Memphis, Louisiana, NC State, Louisiana Tech, and Texas A&M generated more than 1.5 total wins over their expected number.
Louisiana and Texas A&M stick out from this group, considering both are expected to have quite a bit of success in 2021.
The Ragin' Cajuns are favored to win the Sun Belt this season after going 10-1 last year, as it brings back almost everyone from that squad.
Seven of Louisiana’s 11 games finished within a touchdown last year, and the Ragin' Cajuns went 6-1 in those games. If ULL doesn't live up to expectations this year, it could be because some of those close games went in the other direction. It's going to be very hard for the Ragin' Cajuns to sustain that record in one-score games in 2021.
Texas A&M had a solid average point differential of just under 11, which would typically lead to a win percentage of 75% instead of 90%. The Aggies played closer to an 8-2 or even 7-3 team than a 9-1 squad. If A&M regresses to the mean in this category next year, it could be very tough to climb over its win total of 9.5.
Just like the teams at the very top, the teams at the very bottom played short seasons as well.
Arizona State’s ranking is misleading because of its four-game schedule. The Sun Devils outscored their opponents, 161-93, over four games, for an average point differential of 17. But if we exclude their 70-7 dismantling of Arizona, their average point differential drops to 1.6.
ASU started the season with two losses by a total of eight points combined but ended very strong with the Arizona game and a 13-point victory over Oregon State.
Louisville and Marshall stick out as two teams with larger samples near the bottom.
Marshall is interesting because it started out the season 7-0 before dropping three straight games to end the year. The Herd scored 28.5 points per game while allowing only 13, which resulted in 8.7 expected wins.

Louisville went 4-7 last year despite a positive point differential. Its expected win percentage finished at about 57%, which would have resulted in just over six wins in an 11-game season.
The Cardinals went 0-4 in one-score games, which led to the disappointing record. They were actually the only team that was at least two wins away from expected in either direction.
If Louisville can just get back to average in close games this season, it should have no problem getting back to bowl eligibility.
Louisville is also a great example of how hard it is to outperform expectations year-over-year. The Cardinals ranked near the top in this metric after 2019, when they went 8-5 despite being outscored, 434-430, in total.
To wrap it up, three Mountain West teams had at least a 1.5-win gap between expected wins and actual wins: Wyoming, Air Force, and San Diego State.
Wyoming lost four games, and the worst one was by just 10 points. Its two wins came by a combined 55 points. It either blew its opponent out or lost a tight one.
Air Force finished with a .500 record despite an average point differential of over 9.
The Aztecs also finished .500 with a +55 point differential over eight games. All three should expect to regress closer to the mean in 2021.

