UTEP vs UTSA Odds
| UTEP Odds | ||
|---|---|---|
| Spread | Total | Moneyline |
+16.5 -108 | 56.5 -106o / -114u | +570 |
| UTSA Odds | ||
|---|---|---|
| Spread | Total | Moneyline |
-16.5 -112 | 56.5 -106o / -114u | -850 |
As they close out their regular season, UTSA hosts UTEP in an in-state Conference USA matchup on Saturday afternoon.
UTEP enters this game with 5-6 record and comes into this game following a home win over Florida International. The Miners are 4-7 against the spread and have gone under in seven games this season.
UTSA comes into the week with a 9-2 record and riding an eight-game winning streak. It's gone 6-5 against the spread and over the total in six of their 11 games.
This game will be played in the Alamodome, so there are no weather concerns to be aware of.
After reaching bowl eligibility for the first time in his UTEP tenure in 2021, Dana Dimel's Miners need an upset win to make a bowl this season.
UTEP is averaging 23.8 points per game and 5.3 yards per play with a 41% Success Rate and 2.95 points per opportunity.
It's managed to control Havoc at 16%, which ranks inside the top 50.
In addition to its struggles in Finishing Drives, its low scoring can also be attributed to its 106th-ranked pace of 28.5 seconds per play.
The Miners are hoping to have injured quarterback Gavin Hardison back for this game after he missed the FIU game.
But as a whole, the UTEP passing offense has struggled. As a team, it's completed 53.5% of its passes for 6.7 yards per attempt. It owns a 40% Passing Success Rate and averages 2.8 20-yard passes per game.
On the ground, two backs — Deion Hankins and Ronald Awatt — have at least 130 rush attempts, and both have eclipsed 650 rushing yards. As a team, the Miners are averaging 4.2 yards per attempt.
UTEP has a 42% Rushing Success Rate, and its offensive line generates an average of 3.27 Line Yards per attempt while allowing a 14% Stuff Rate.
Compared to its offense, UTEP's defense is a relative strength. But compared to national averages, it's still fairly weak.
It allows 26.4 points per game and 5.7 yards per play to go along with a 43% Defensive Success Rate and 4.1 points per opportunity. It has also generated Havoc on 19% of plays.
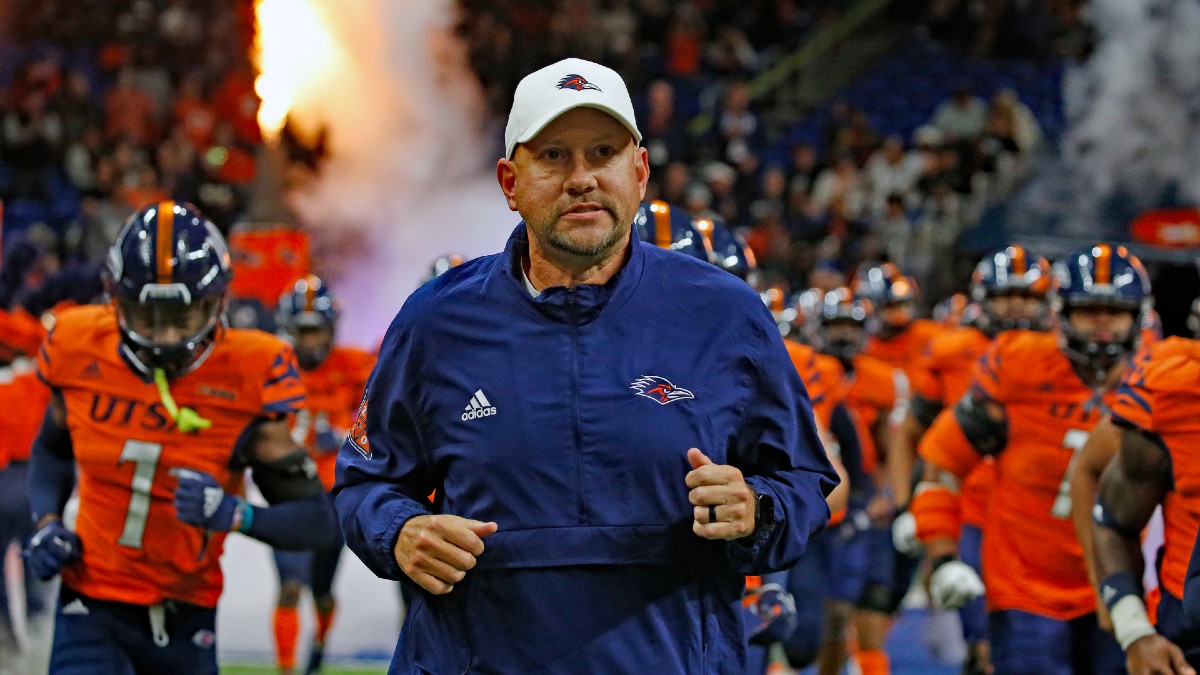
Jeff Traylor once again has the Roadrunners in a position to win the conference.
UTSA averages 38.3 points per game and 6.4 yards per play to go with a 49% Success Rate and 4.51 points per opportunity — the latter of which rank inside the top 25.
It allows Havoc on just 15% of plays and runs at a top-20 pace of 23.7 seconds per play.
Quarterback Frank Harris has completed 69.5% of his passes for an average of 8.5 yards per attempt. The Roadrunners have a 52% Passing Success Rate and average 3.8 passes over 20 yards per game.
Brenden Brady has led the way for a Roadrunners offense that averages 39.2 rush attempts per game. As a team, they boast a Rushing Success Rate of 47%. The O-line creates 3.47 Line Yards per attempt and has allowed a Stuff Rate of just 11.5%.
UTSA allows 26.1 points per game and 5.6 yards per play. Its 36% Success Rate Allowed ranks 11th nationally. It also gives up just 3.18 points per opportunity and produces Havoc on 22% of plays.
UTEP vs UTSA Matchup Analysis
Toggle the dropdowns below to hide or show how UTEP and UTSA match up statistically:
UTEP Offense vs. UTSA Defense
Offense | Defense | Edge | |
| Rush Success | 85 | 4 | |
| Line Yards | 19 | 6 | |
| Pass Success | 87 | 46 | |
| Pass Blocking** | 11 | 62 | |
| Havoc | 40 | 19 | |
| Finishing Drives | 124 | 18 | |
| ** Pass Blocking (Off.) vs. Pass Rush (Def.) | |||
UTSA Offense vs. UTEP Defense
Offense | Defense | Edge | |
| Rush Success | 39 | 79 | |
| Line Yards | 11 | 65 | |
| Pass Success | 7 | 74 | |
| Pass Blocking** | 93 | 18 | |
| Havoc | 15 | 26 | |
| Finishing Drives | 21 | 97 | |
| ** Pass Blocking (Off.) vs. Pass Rush (Def.) | |||
Pace of Play / Other
| PFF Tackling | 124 | 126 |
| PFF Coverage | 120 | 53 |
| SP+ Special Teams | 26 | 55 |
| Seconds per Play | 28.5 (106) | 23.7 (17) |
| Rush Rate | 54.3% (63) | 51.9% (80) |
Data via CollegeFootballData.com (CFBD), FootballOutsiders, SP+, Pro Football Focus and SportSource Analytics.
UTEP vs UTSA Betting Pick
The line for this game opened at UTSA -17 with a total of 56.5, and both the betting public and sharps have embraced the underdog catching three scores.
As of writing, 82% of bets and 94 percent of the money are backing UTEP in this game.
From a statistical perspective, UTSA has a significant advantage in almost all of the meaningful statistics. The Roadrunners boast one of the most efficient offenses in the country, and while UTEP's defense is a relative strength, it'll be at a disadvantage when compared to this UTSA team.
And for a UTEP offense that prefers to lean on the running game — particularly if starting Hardison is not 100% — it'll be attacking the strength of this UTSA defense.
While I'm typically inclined to follow the sharp money, my preferred play is on UTSA under 20.5.
From my perspective, the best chance for UTEP is to slow down this game and limit scoring. So, if you're looking for a hedge play, it's likely on the under.
Pick: UTSA -16.5 (Play to 20.5) |
What is QuickSlip?
QuickSlip is an Action Network feature that allows users to automatically pre-load their bet slip at FanDuel Sportsbook.


