We've made it to yet another glorious weekend of college football.
However, don't run to the counter just yet. Make sure you read this article to make some informed decisions on where to place your money this weekend based on college football's most important advanced stats.
This breakdown looks at four metrics that have been found to be relevant to covering the spread:
- Havoc
- Success Rate
- Finishing Drives
- Explosiveness
If you are interested in why these metrics have been chosen, check out this piece by Collin Wilson. To quote his findings:
"Data from the past five years indicates defensive Success Rate, Havoc and Finishing Drives are the biggest indicators in beating oddsmakers this college football season."
We're throwing explosiveness in here as well. With that in mind, let's dive in and see where we can find an edge in Week 10.
Havoc
What is Havoc?
Havoc is a college football term defined as a play where there’s an unexpected outcome.
Pass breakups, forced fumbles and tackles for loss are just a few of the plays that cause pandemonium on any given Saturday. These plays, collectively, are used to build an identity for a team.
The calculation for Havoc is simply a cumulative number of tackles for loss, interceptions, fumbles and passes defensed divided by the number of plays on both sides of the ball.
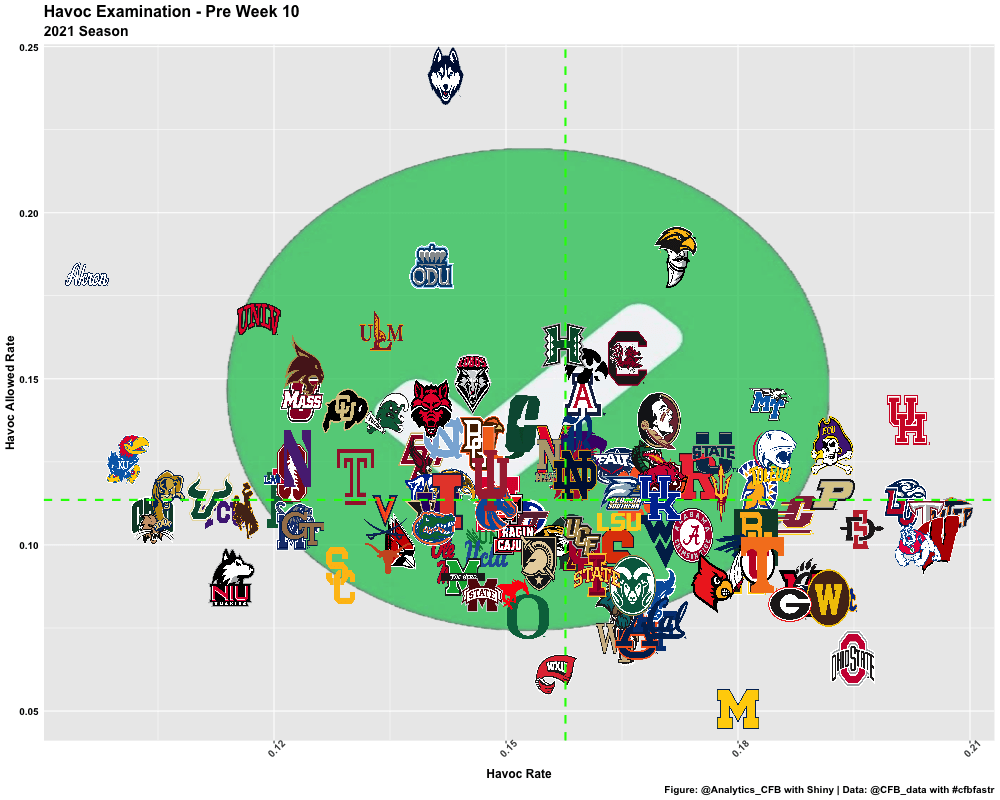
Let's take a look at how each team's Havoc Rate and Havoc Allowed Rate compare:
Some Quick Takeaways
- Michigan vs. Ohio State will be a must-watch game from a Havoc perspective when they play. Despite the loss to Michigan State, the Wolverines have a lot to play for against the Buckeyes, who are trying to earn a trip to the College Football Playoff.
- Outside of Georgia, the current playoff teams certainly do not pop off this graph. Ohio State, on the outside looking in, is the most impressive.
- I think I've made a comment about how this TCU team is very un-Gary Patterson-like with a low Havoc Rating, and now it's without him. Permanently. Can't see how this improves things for the defense this season.
- Could Liberty give Ole Miss all it can handle at the line of scrimmage?
As we harp on each week, these charts are great to see how each team stacks up nationally but can be tough to see where the advantages lie on a game-by-game basis. So, let's break it down that way.
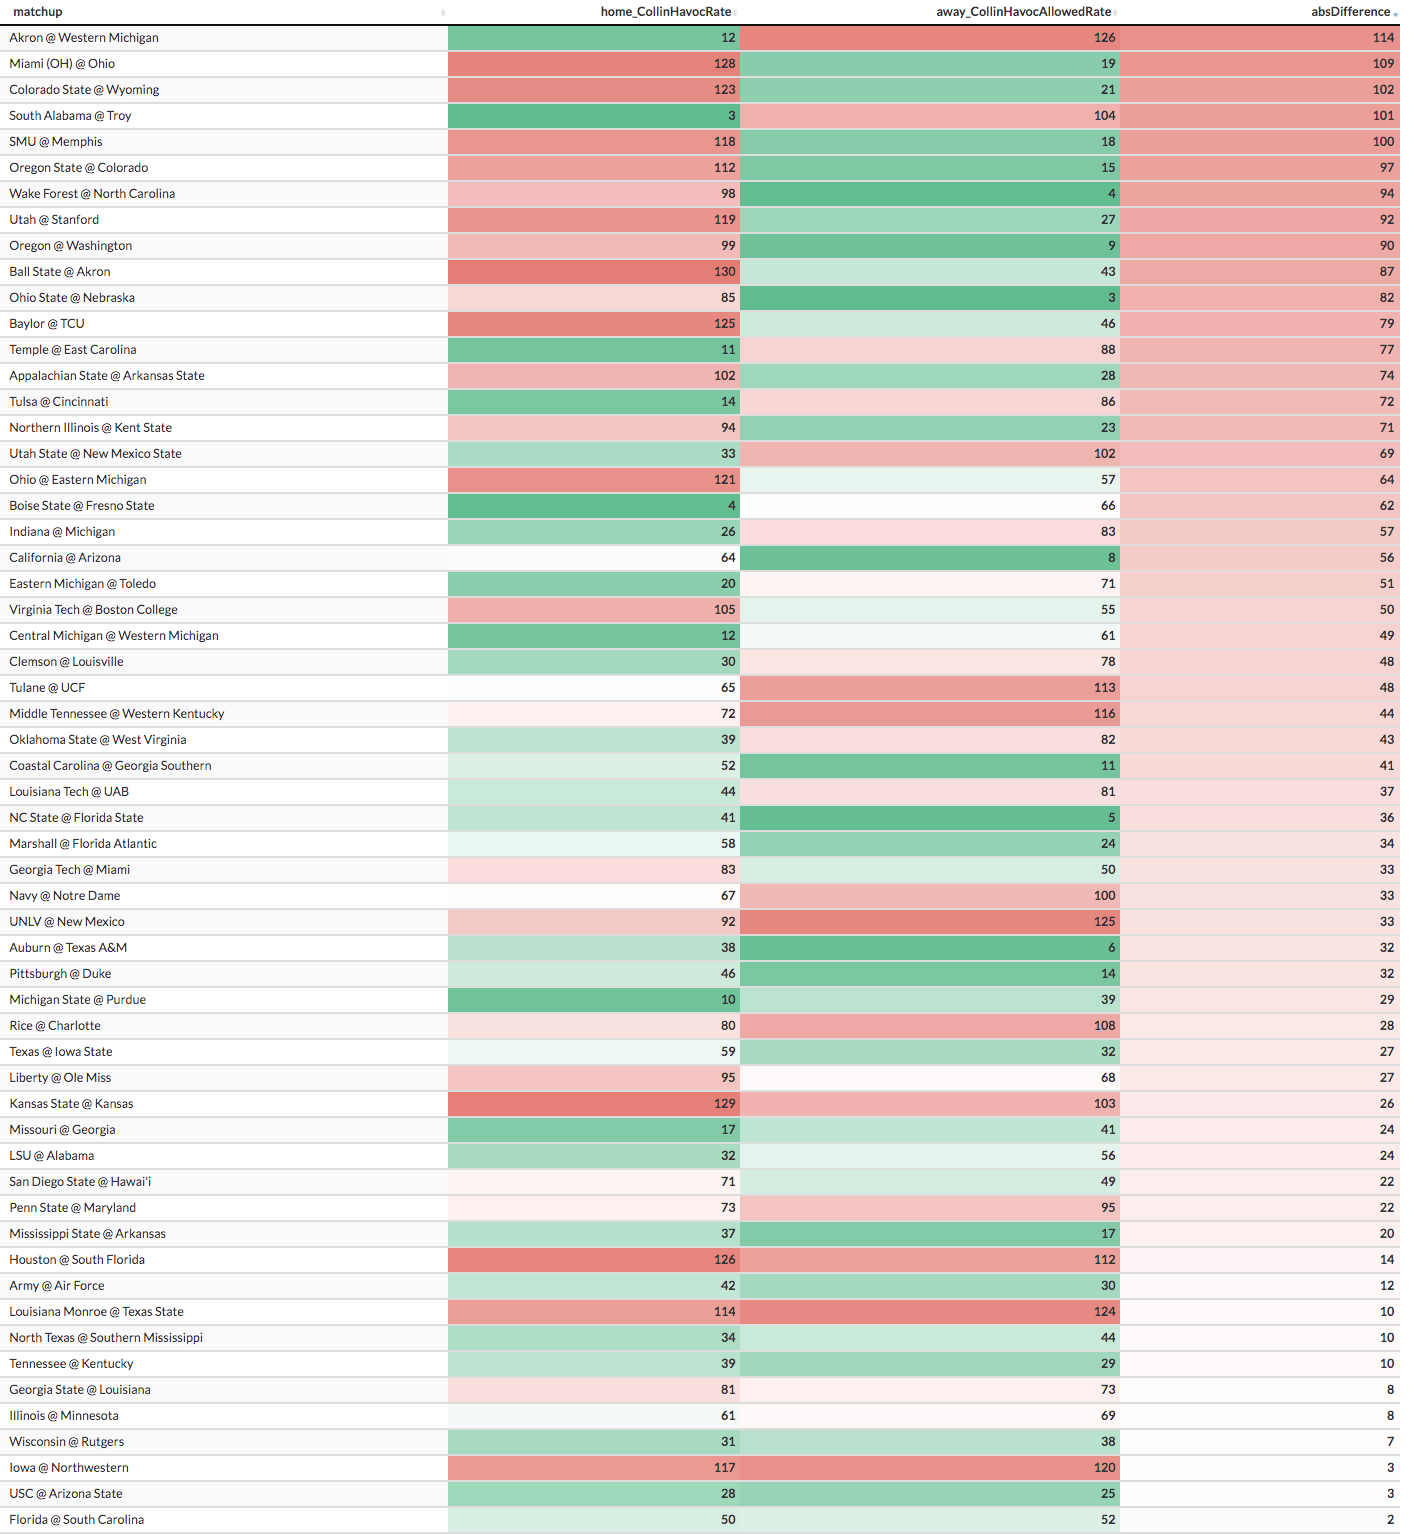
Home Team Havoc Rate vs. Away Team Havoc Allowed Rate
Biggest Mismatches (ignoring Games Played)
- Colorado State's Defense vs Wyoming's Offense
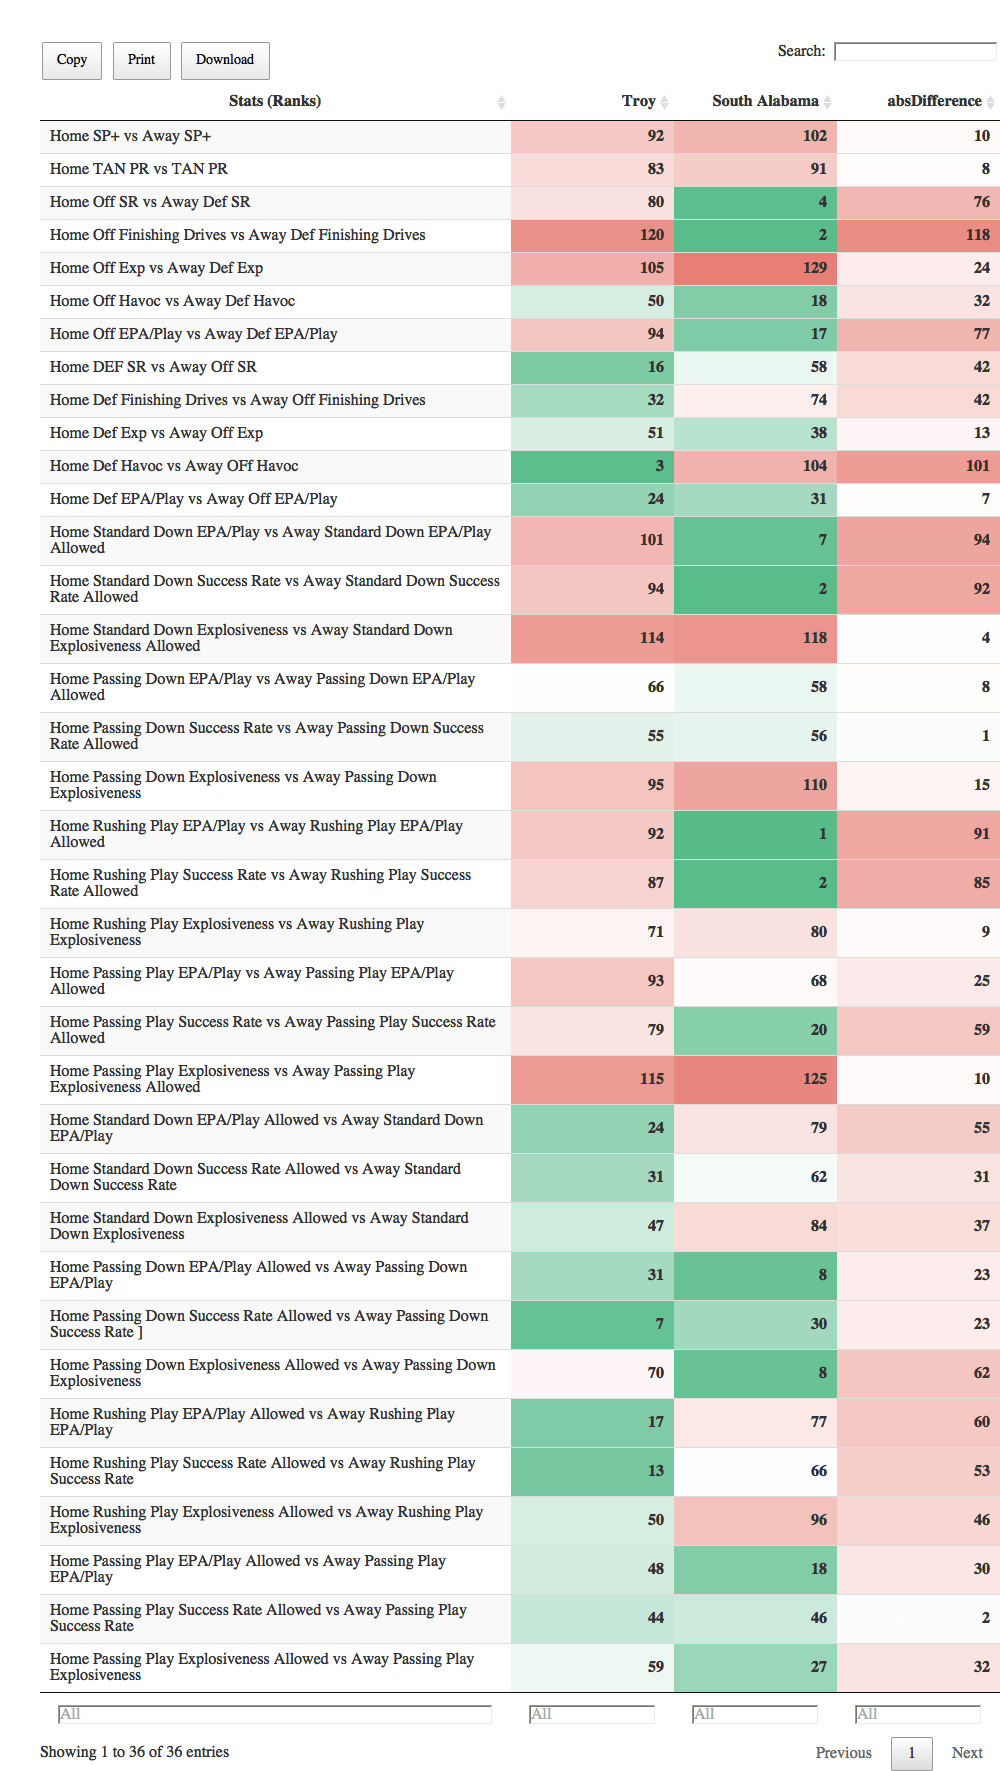
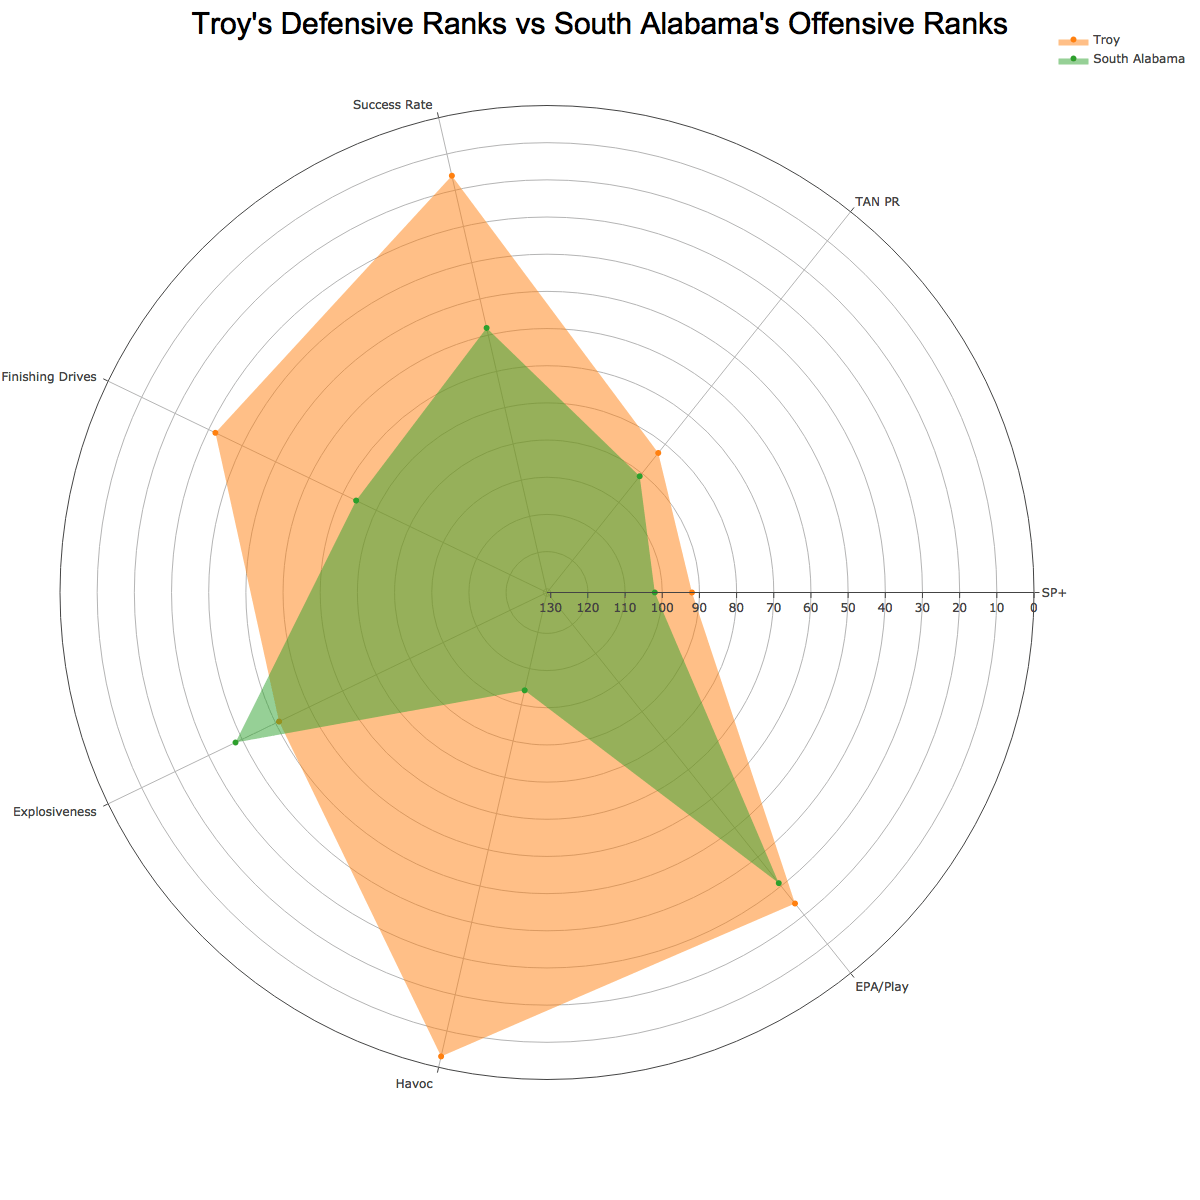
- Troy's Defense vs South Alabama's Offense
- SMU's Offense vs. Memphis' Defense
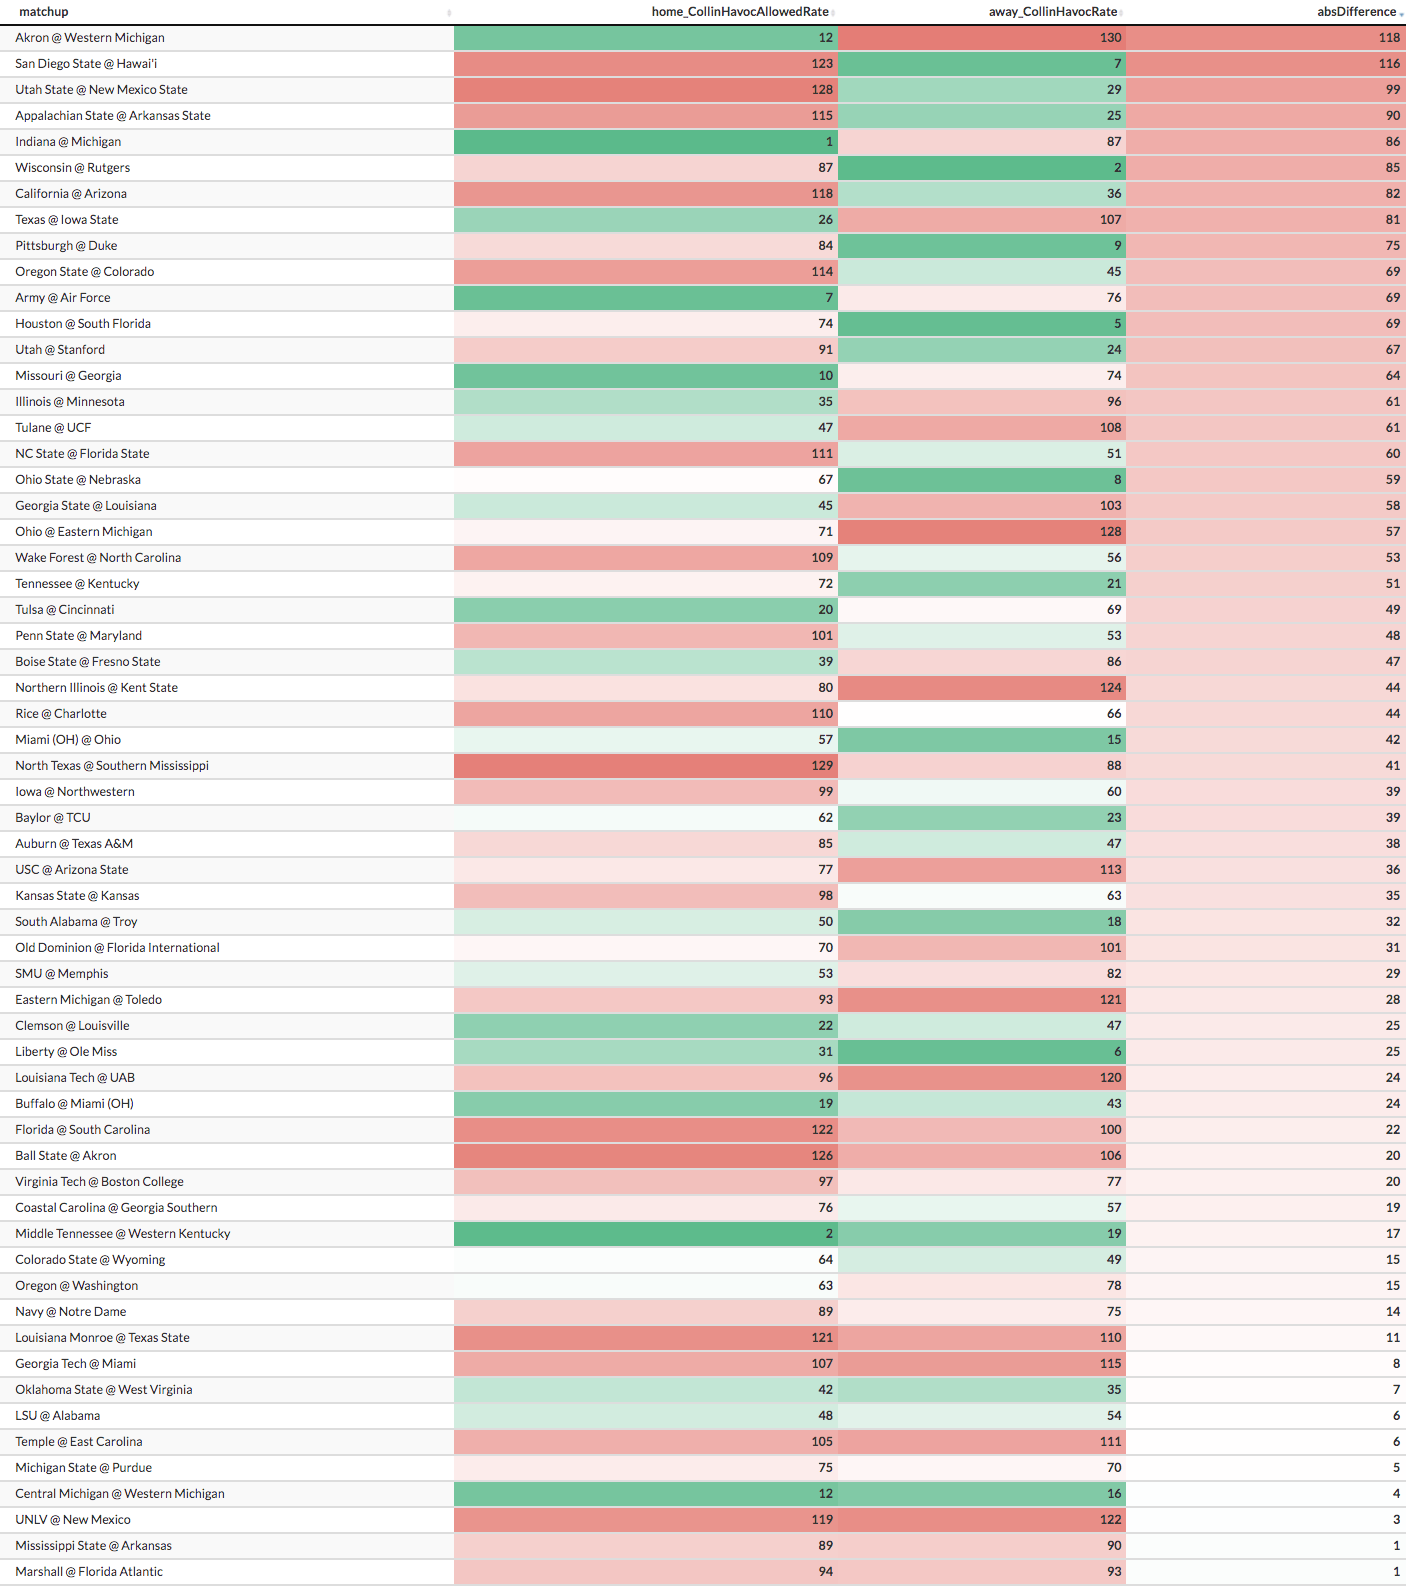
Home Team Havoc Allowed Rate vs. Away Team Havoc Rate
Biggest Mismatches (Ignoring Games Played)
- San Diego State's Defense vs Hawaii's Offense
- Utah State's Defense vs New Mexico State's Offense
- Appalachian State's Defense vs Arkansas State's Offense
Finishing Drives
What is Finishing Drives?
Finishing Drives is points per opportunity when the offense passes its opponent's 40-yard line. Defensively, this is how many points per opportunity a defense allows when the opposing offense crosses the 40-yard line.
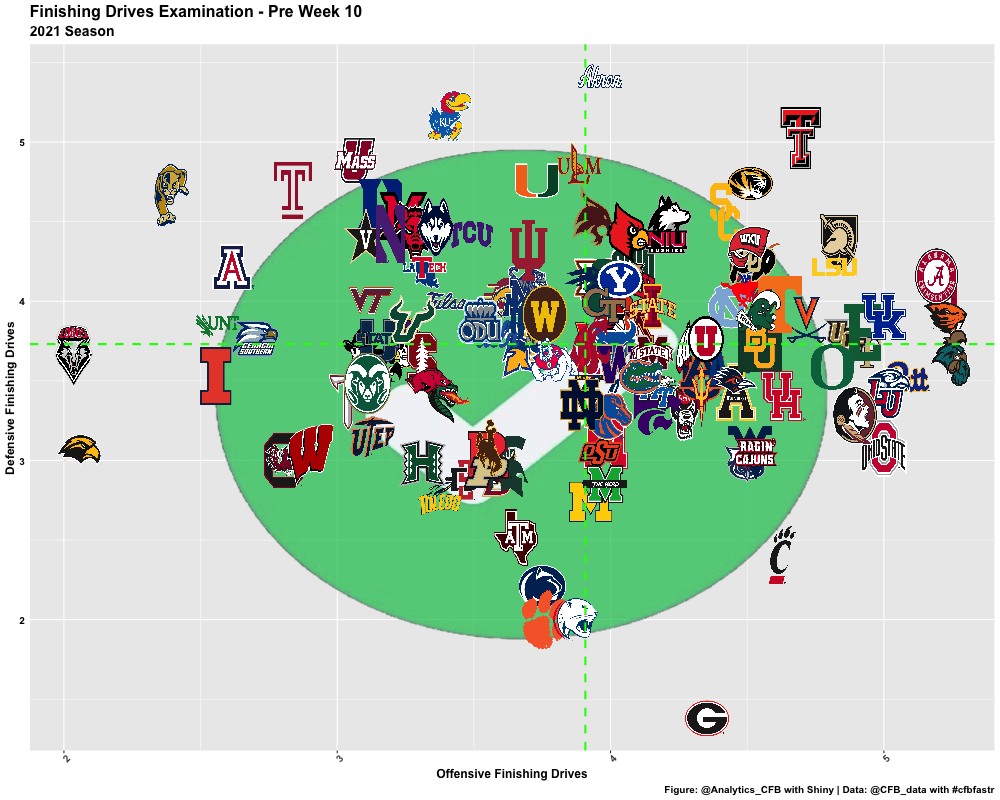
Offensive Finishing Drives vs. Defensive Finishing Drives
General Notes & Observations
- Georgia: still historically good.
- We expect to see Akron, Kansas, etc. at the top of this chart (bad defense), but to see Mizzou and Miami is a shocker at this point in the season.
- Alabama has the worst defense when it comes to keeping opponents out of the end zone of any of the CFP teams (plus Ohio State and Cincinnati).
- Clemson, Penn State and Texas A&M still have good defenses despite their disappointing seasons. There could be value here, especially with Clemson.
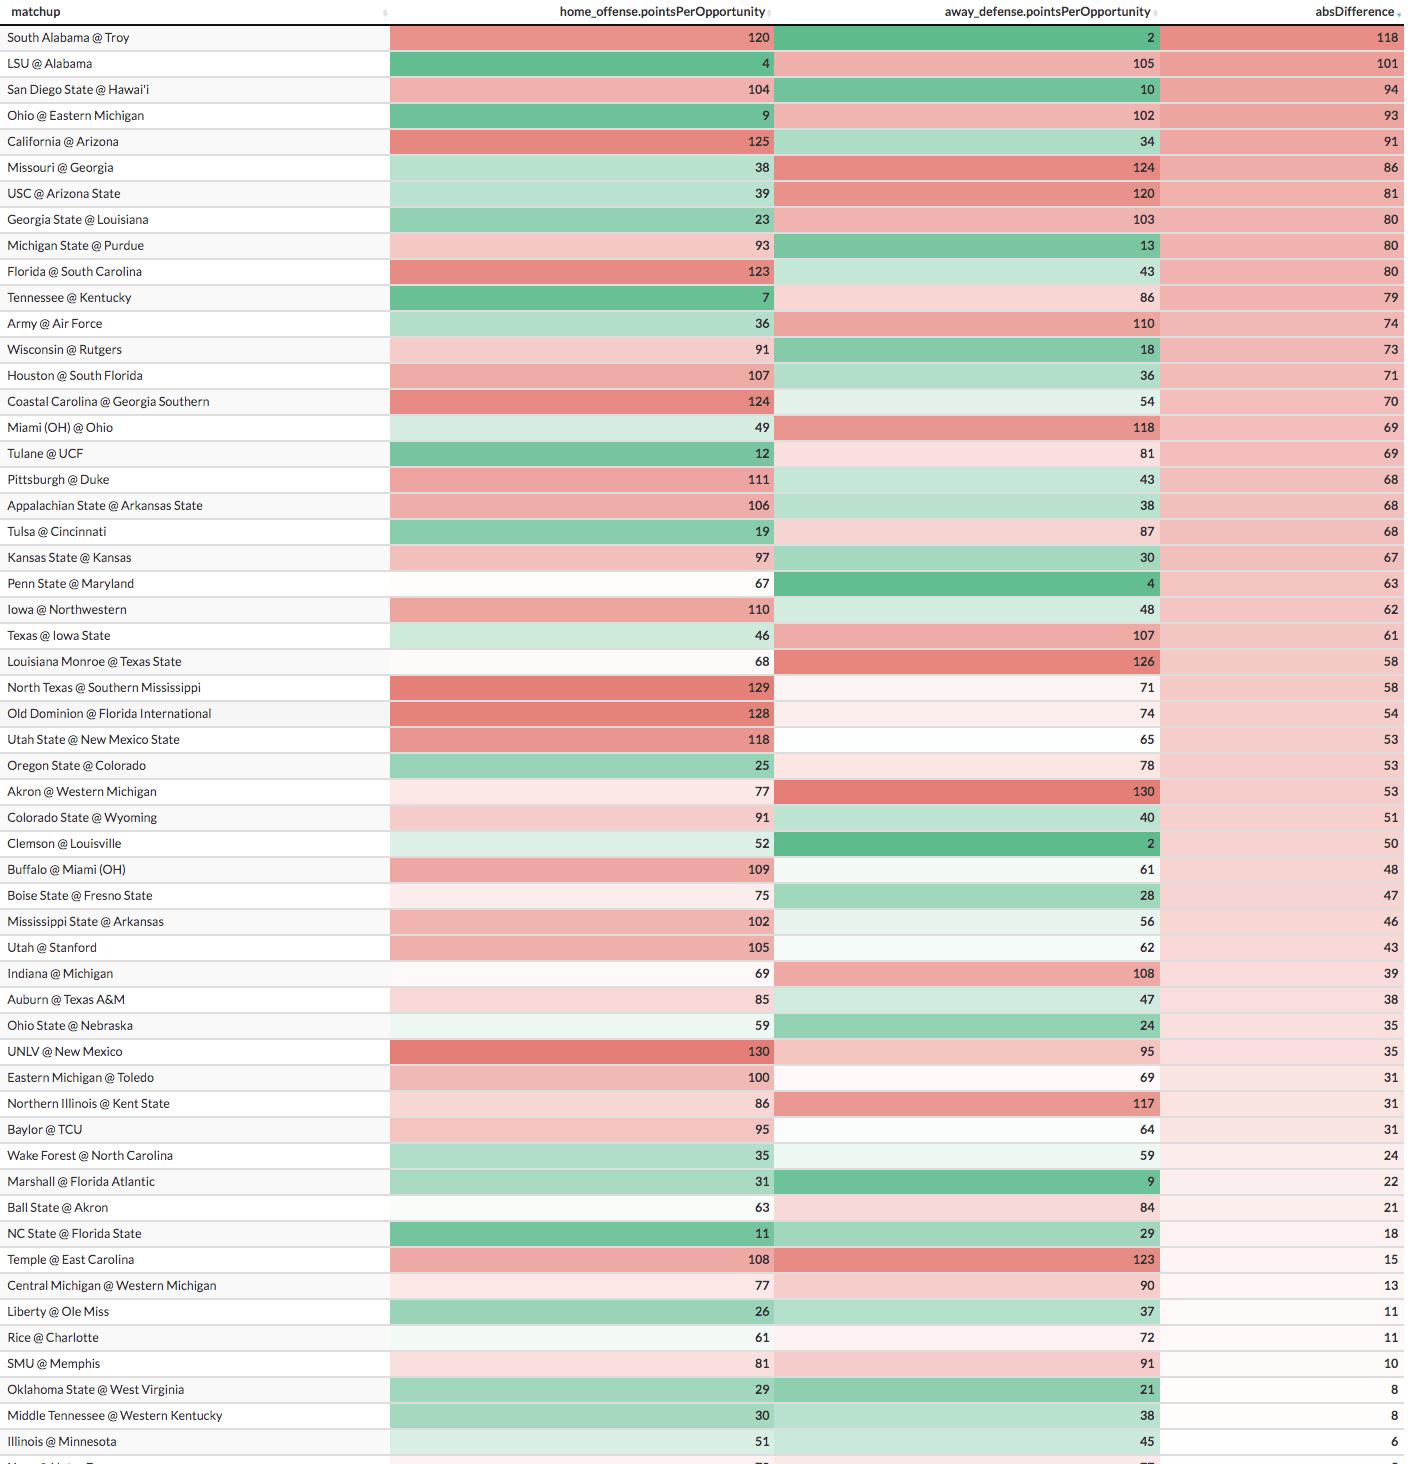
Home Team Offensive Finishing Drives Rank vs. Away Team Defensive Finishing Drives Rank
Biggest Mismatches
- South Alabama's Defense vs Troy's Offense
- Alabama's Offense vs LSU's Defense
- San Diego State's Defense vs Hawaii's Offense
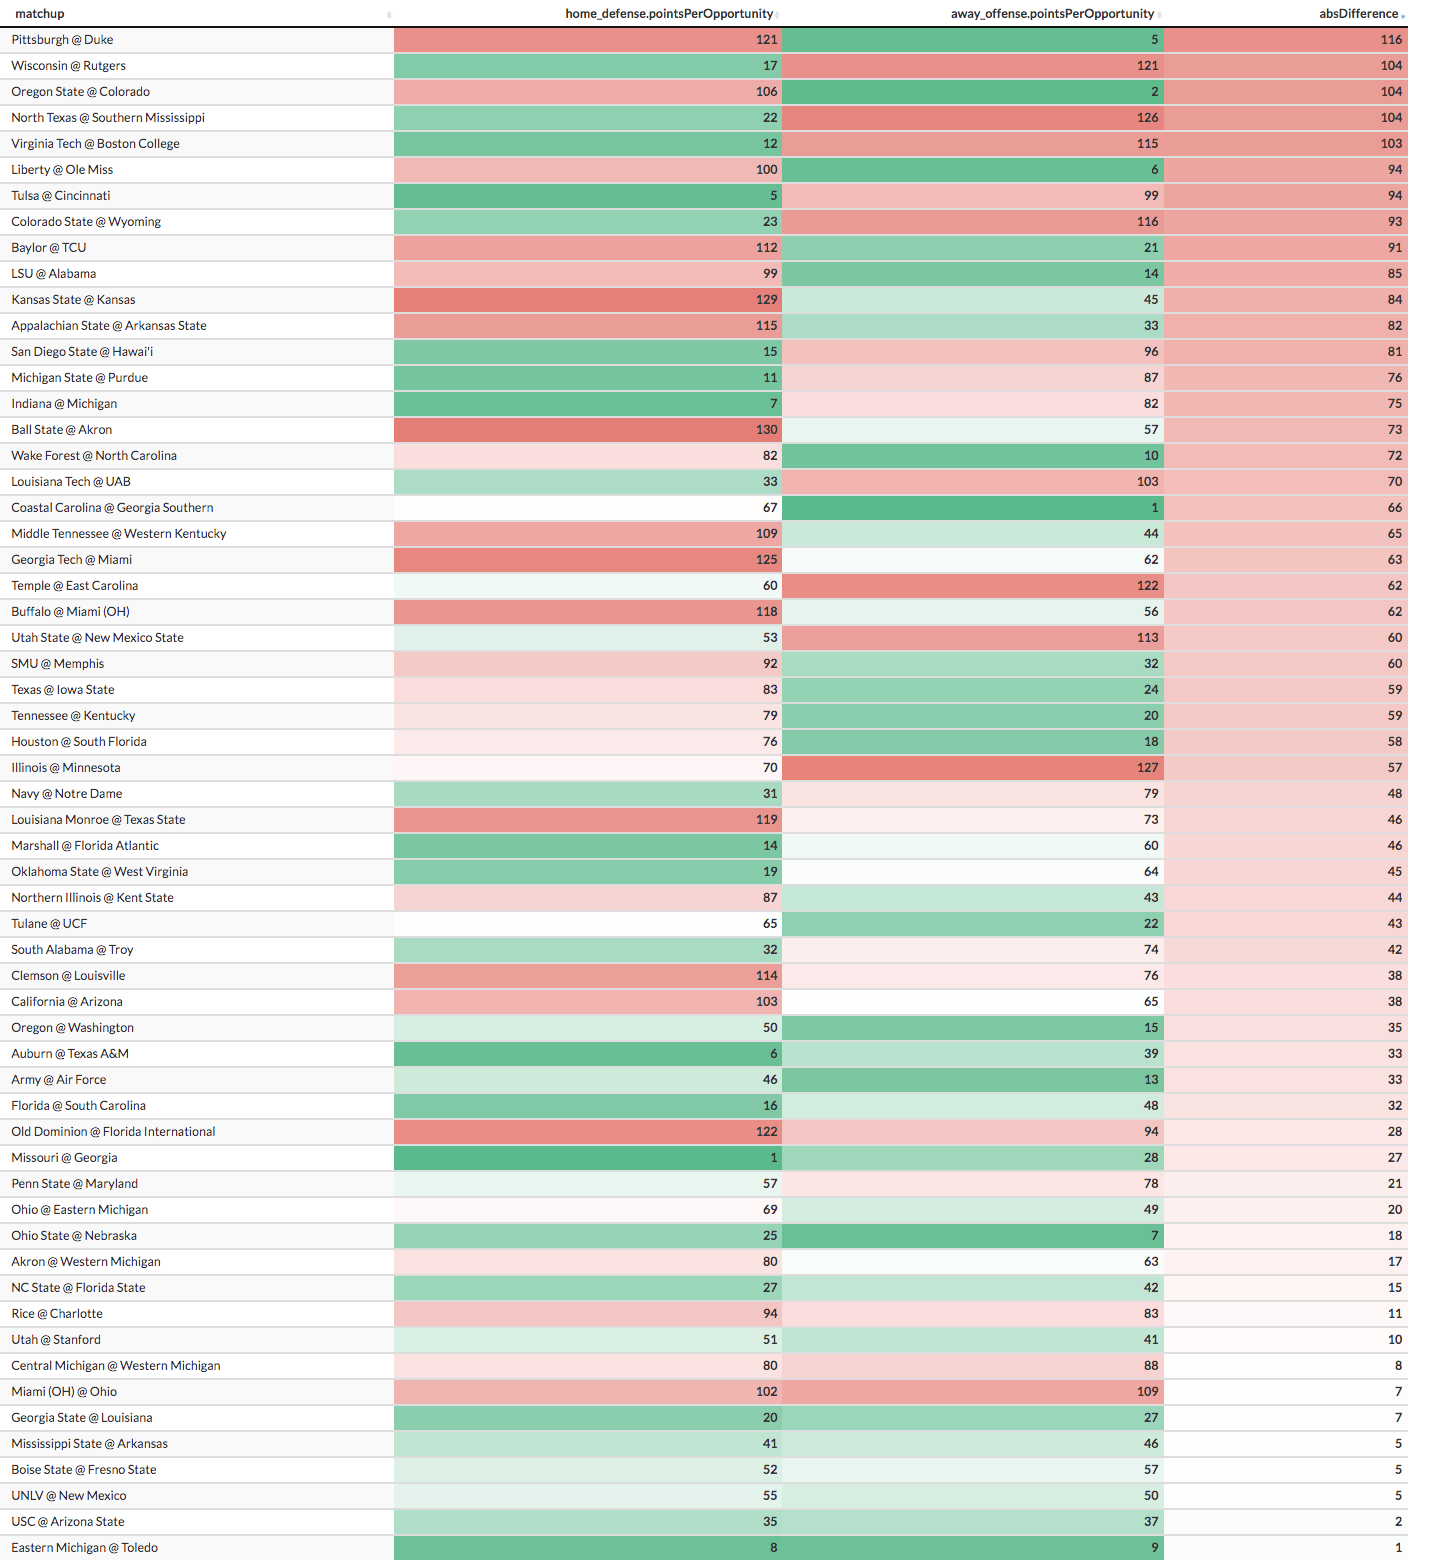
Home Team Defensive Finishing Drives Rank vs. Away Team Offensive Finishing Drives Rank
Biggest Mismatches
- Pitt's Offense vs Duke's Defense
- Rutgers' Defense vs Wisconsin's Offense
- Oregon State's Offense vs Colorado's Defense
Success Rate
What is Success Rate?
Success Rate is an advanced metric in football that measures efficiency, but with the important context of down and distance considered.
A play is defined as successful if:
- It gains at least 50% of the yards required to move the chains on first down
- 70% of yards to gain on second down
- 100% of yards to gain on third or fourth down
To calculate Success Rate, simply divide the number of successful plays (as defined by down and distance above) by total plays.
This definition is straight from our article on Success Rate. So, which teams excel at moving the chains?
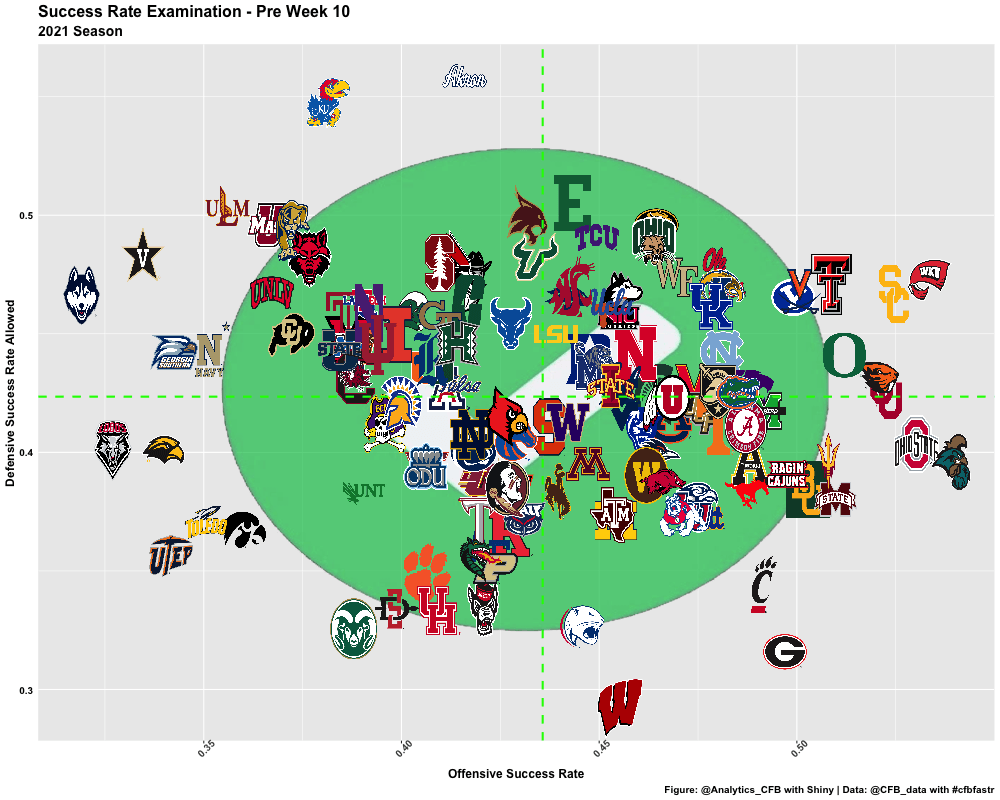
Offensive Success Rate vs. Defensive Success Rate
General Notes & Observations
(Once again, top left is bad and bottom right is good)
- Cincinnati should be in the playoff. Sorry, not sorry. Its metrics are too good.
- Oregon State vs. Oregon may be the best rivalry game to watch on rivalry weekend.
- Alabama is still very middle-of-the-pack.
- What happened to Iowa…? *Checks this chart.* Oh, it can't move the ball.
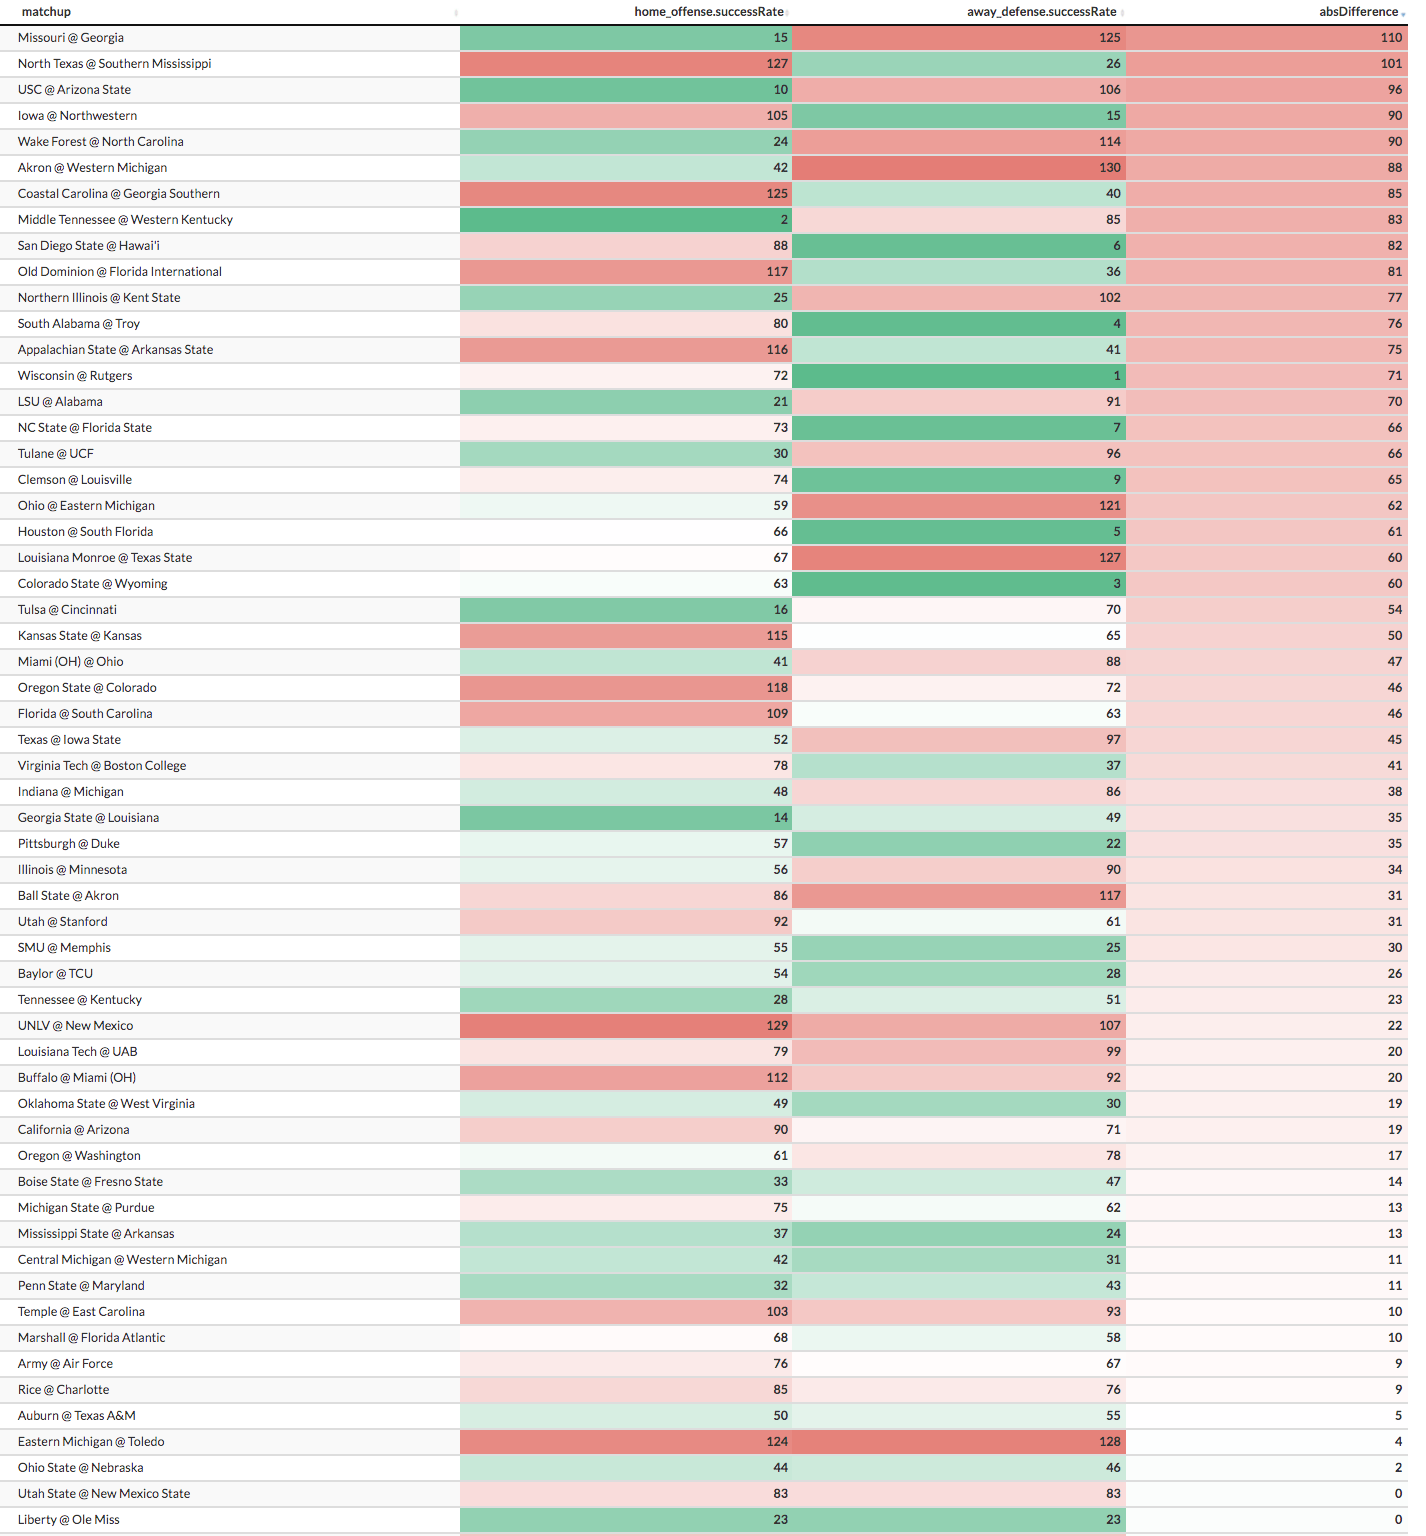
Home Team Success Rate vs. Away Team Success Rate Allowed
Biggest Mismatches
- Georgia's Offense vs Mizzou's Defense
- North Texas' Defense vs Southern Mississippi's Offense
- Arizona State's Offense vs USC's Defense
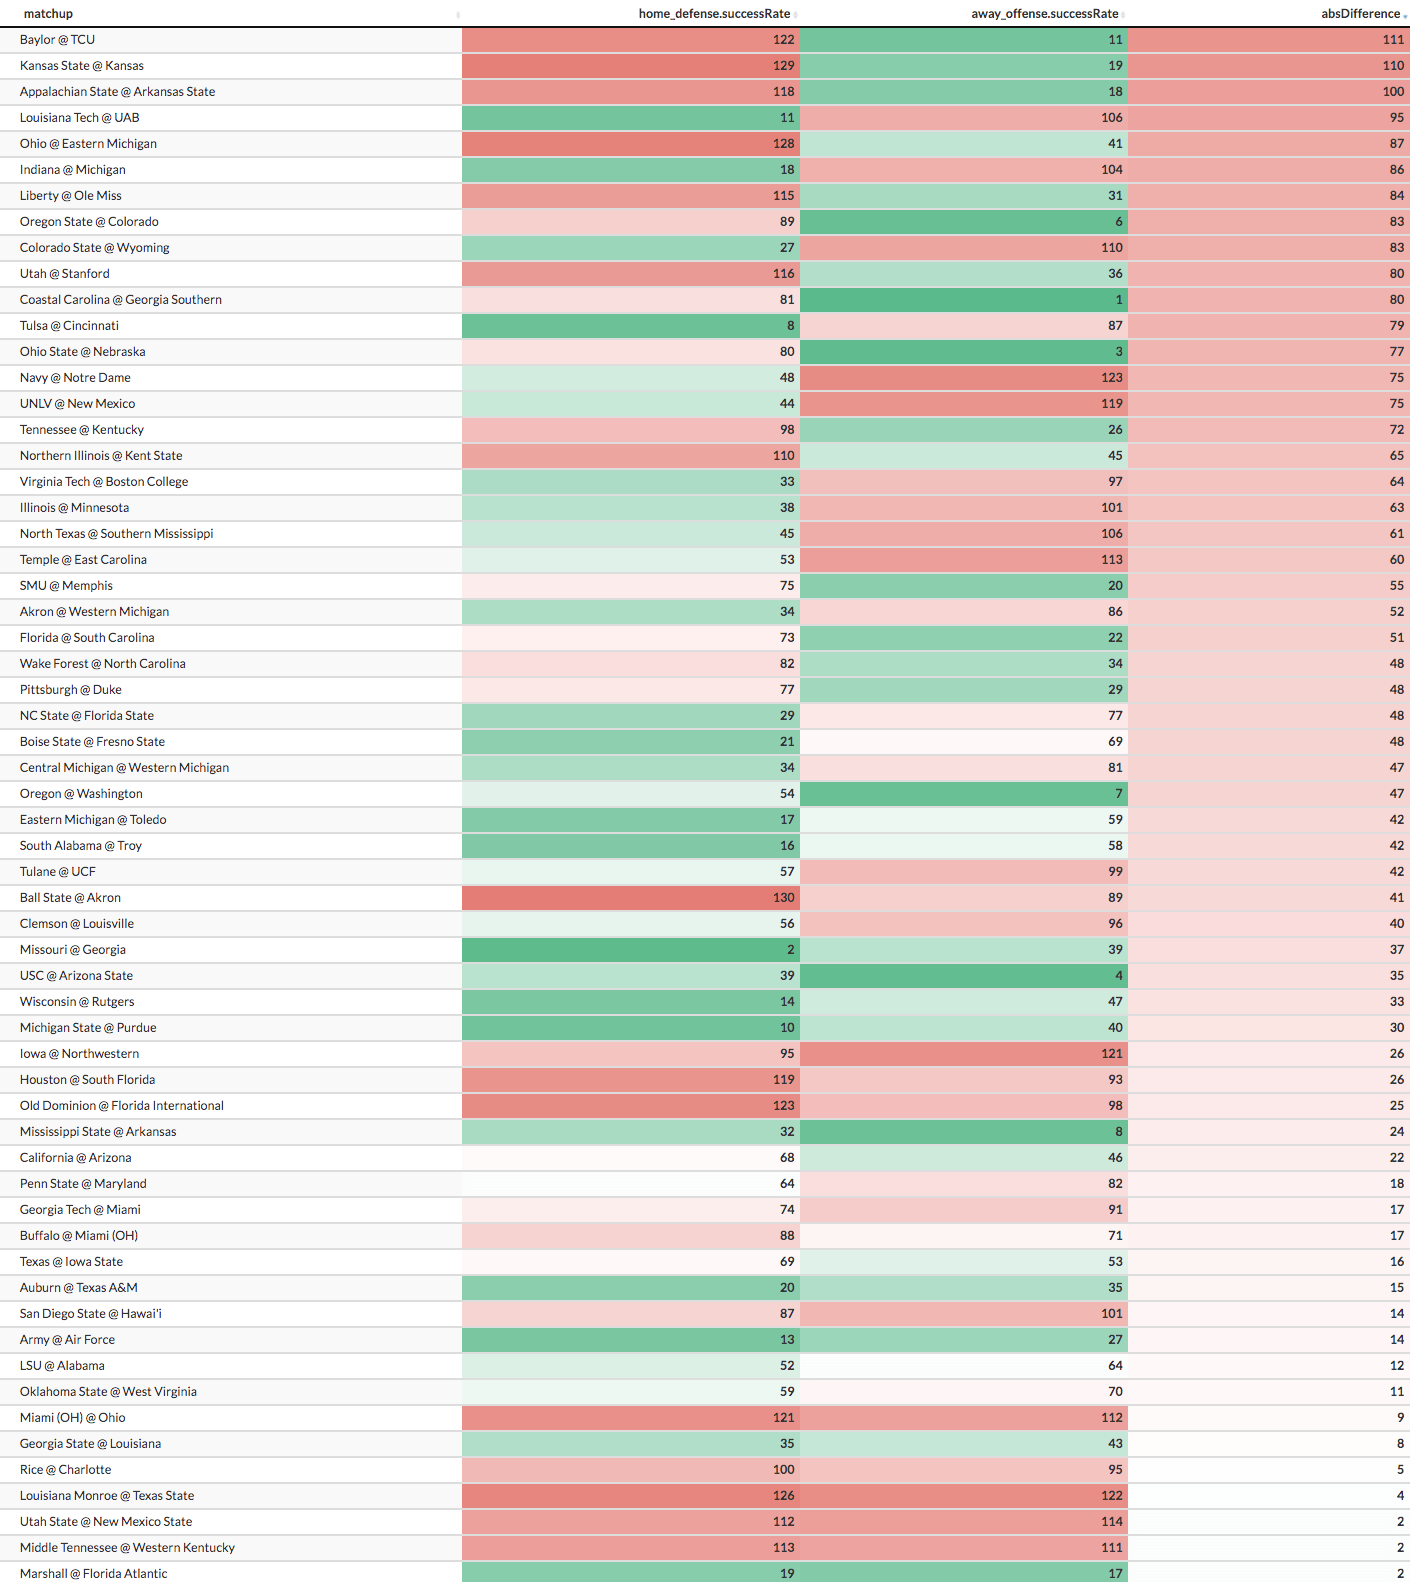
Home Team Success Rate Allowed vs. Away Team Success Rate
Biggest Mismatches
- Baylor's Offense vs TCU's Defense
- Kansas State's Offense vs Kansas' Defense
- Appalachian State's Offense vs Arkansas State's Defense
Explosiveness
Per College Football Data (CFBD), Explosiveness measures the average EPA on plays that were marked as successful. We are using this definition since we are using their metrics.
General Notes & Observations
(Once again, top left is bad and bottom right is good)
- Georgia, good Lord. Let your opponents have some fun.
- The Carson Strong Effect is in full force in Reno this year.
- SMU is exactly where it should be.
- Clemson, Wisconsin and Indiana all had high hopes going into this season, but they were explosively shot down!
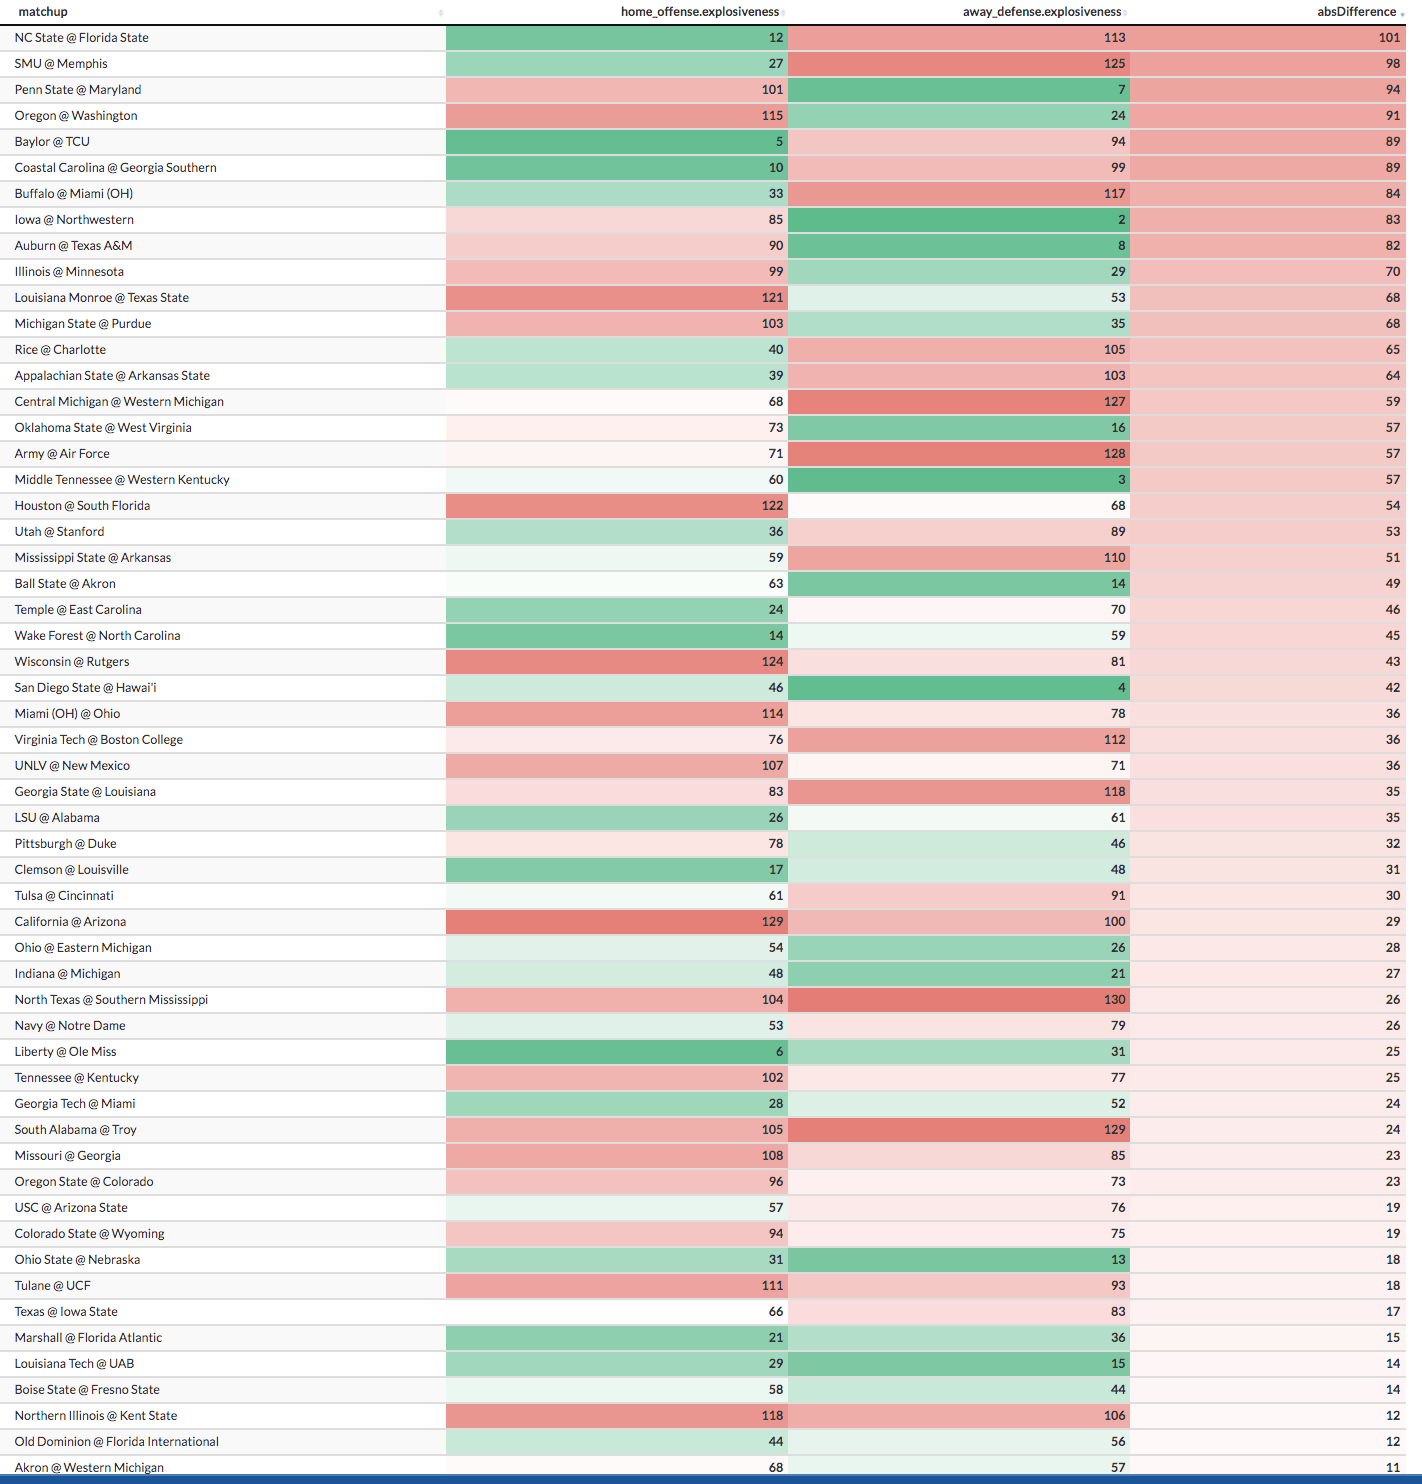
Home Team Explosiveness vs. Away Team Explosiveness Allowed
Biggest Mismatches
- Florida State's Offense vs NC State's Defense
- Memphis' Offense vs SMU's Defense
- Penn State's Defense vs Maryland's Offense
Home Team Explosiveness Allowed vs. Away Team Explosiveness
Biggest Mismatches
- Coastal Carolina's Offense vs Georgia Southern's Defense
- Utah State's Offense vs New Mexico State's Defense
- Pittsburgh's Offense vs Duke's Defense
Week 10 Betting Takeaways
Congratulations on finishing this article (it can be a little dense), but now that you're here, it's time to reap the rewards. Based on these charts, what edge can we gain against the books?
Over our last three picks, we've gone 2-2. We missed on the total last week, but we actually have two picks on one game in this article.
Which game? How about South Alabama at Troy?
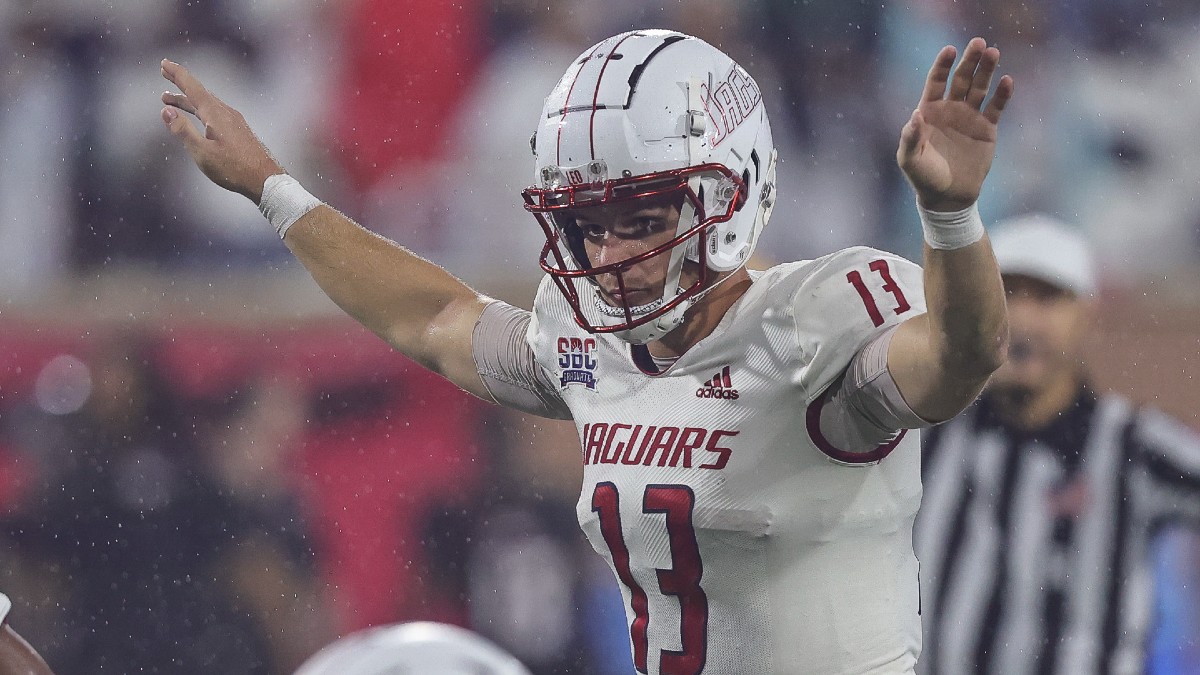
We're going back to the Jaguars, ladies and gentlemen. This South Alabama team is just far too good on defense to be dogs to a Troy team with a very underwhelming offense.
This will likely be a game with a lot of stalled drives, which is an under bettor's dream. A low-scoring game also favors the Jaguars, which I think will happen.
This total has moved down a couple of points already to 47.5. I would not bet any lower than that. I would also take the Jags at +3.5, but only if you can get the half point.


