Congratulations folks. You've grinded and made it through the work week. Your reward is at hand: a full slate of college football to bet this Saturday.
But before you go running to the counter, make sure you read this article to make some informed decisions on where to place your money this weekend.
This breakdown looks at four metrics that have been found to be relevant to covering the spread:
- Havoc
- Success Rate
- Finishing Drives
- Explosiveness
If you are interested in why these metrics have been chosen, check out this piece by Collin Wilson. To quote his findings:
"Data from the past five years indicates defensive Success Rate, Havoc and Finishing Drives are the biggest indicators in beating oddsmakers this college football season."
We're throwing explosiveness in here as well. With that in mind, let's dive in and see where we can find an edge in Week 9.
Havoc
What is Havoc?
Havoc is a college football term defined as a play where there’s an unexpected outcome.
Pass breakups, forced fumbles and tackles for loss are just a few of the plays that cause pandemonium on any given Saturday. These plays, collectively, are used to build an identity for a team.
The calculation for Havoc is simply a cumulative number of tackles for loss, interceptions, fumbles and passes defensed divided by the number of plays on both sides of the ball.
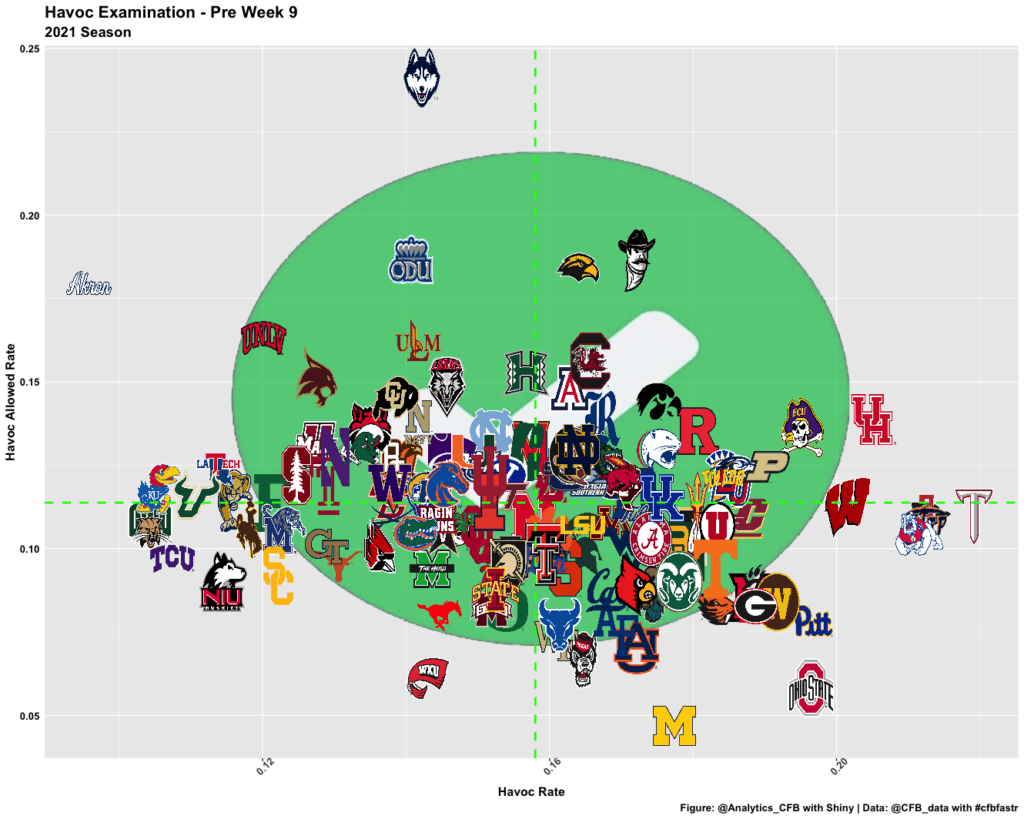
Let's take a look at how each team's Havoc Rate and Havoc Allowed Rate compare:
Some Quick Takeaways
- Michigan leads the country in Havoc Allowed Rate (less than 5% of snaps), while Troy is leading the country in Havoc Rate (23% of snaps).
- Keep UConn's offense in your thoughts every weekend (and do the same for Akron's Defense).
- Ohio State, Michigan, Georgia and Pitt are all dominating the Power Five Havoc-wise.
- The Mountain West has some terrifying defenses in San Diego State and Fresno State.
As we harp on each week, these charts are great to see how each team stacks up nationally but can be tough to see where the advantages lie on a game-by-game basis.
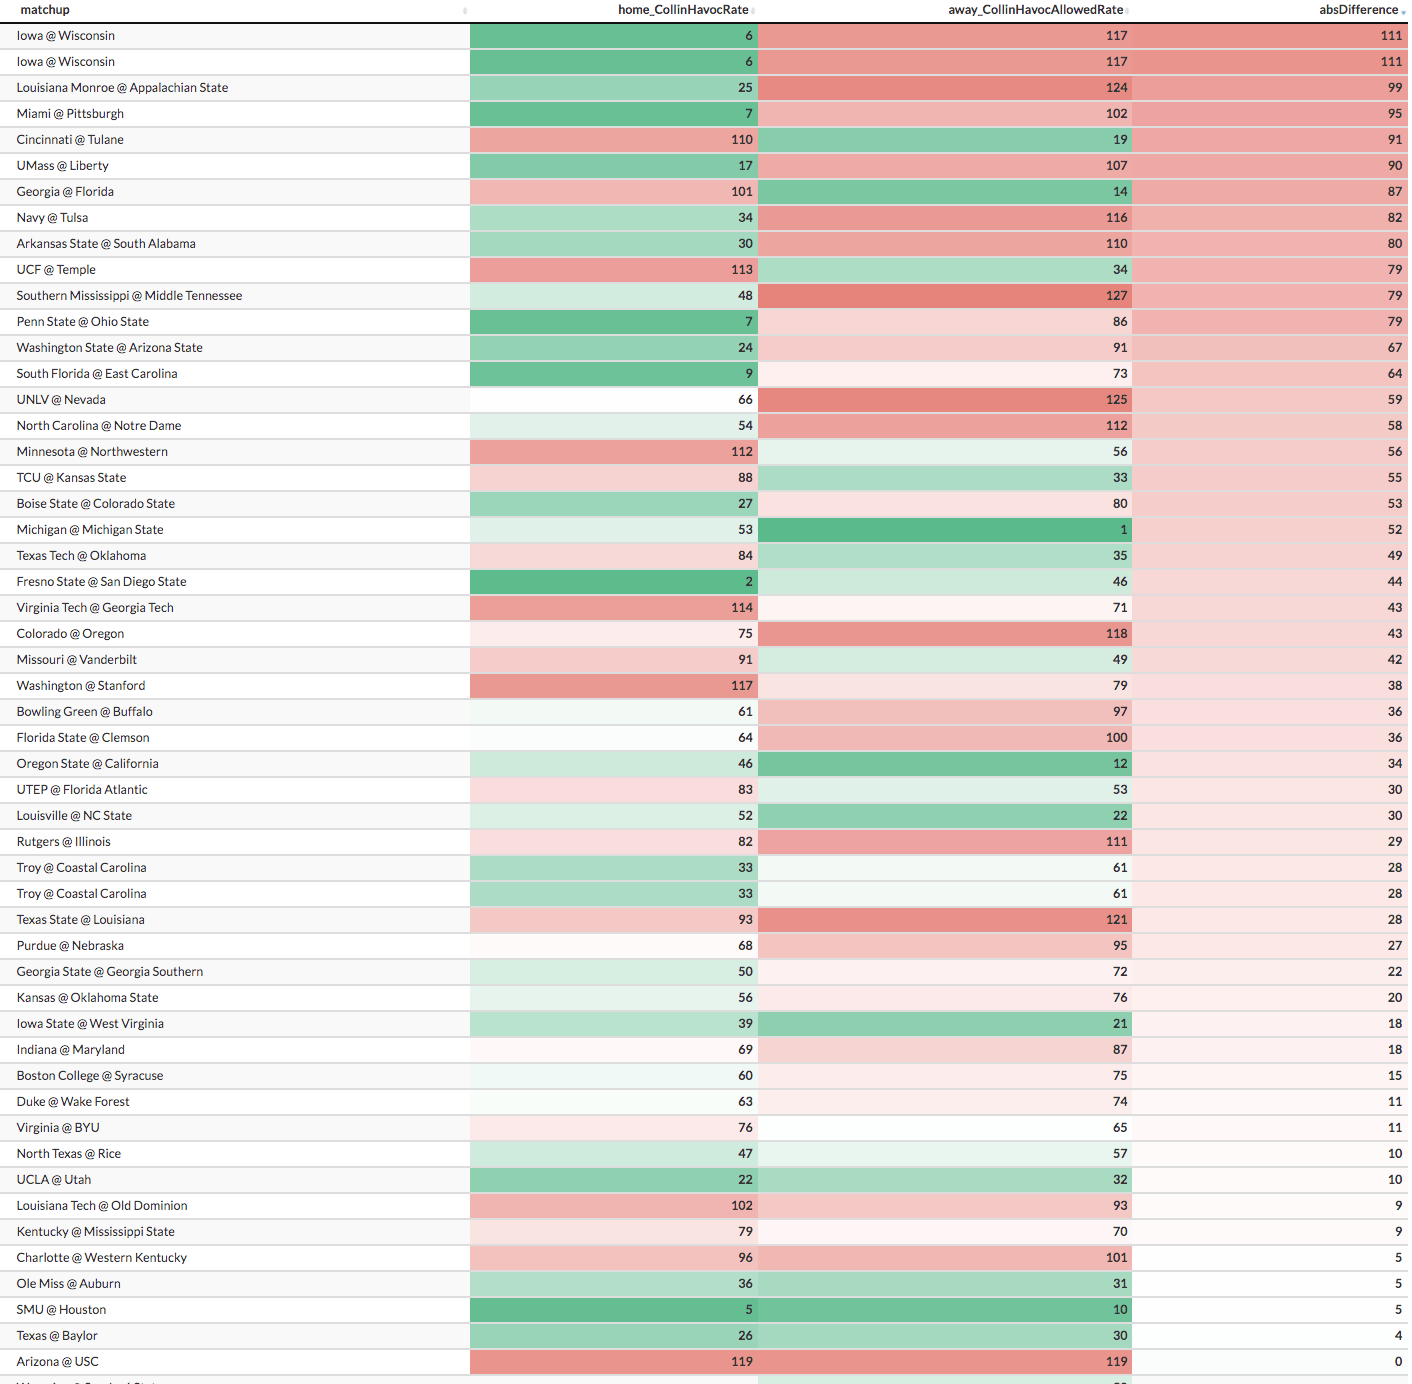
Home Team Havoc Allowed Rate vs. Away Team Havoc Rate
Biggest Mismatches
- Wisconsin's defense vs. Iowa's offense (such a mismatch it's on there twice for emphasis)
- Appalachian State's defense vs. ULM's offense
- Pittsburgh's defense vs. Miami's offense
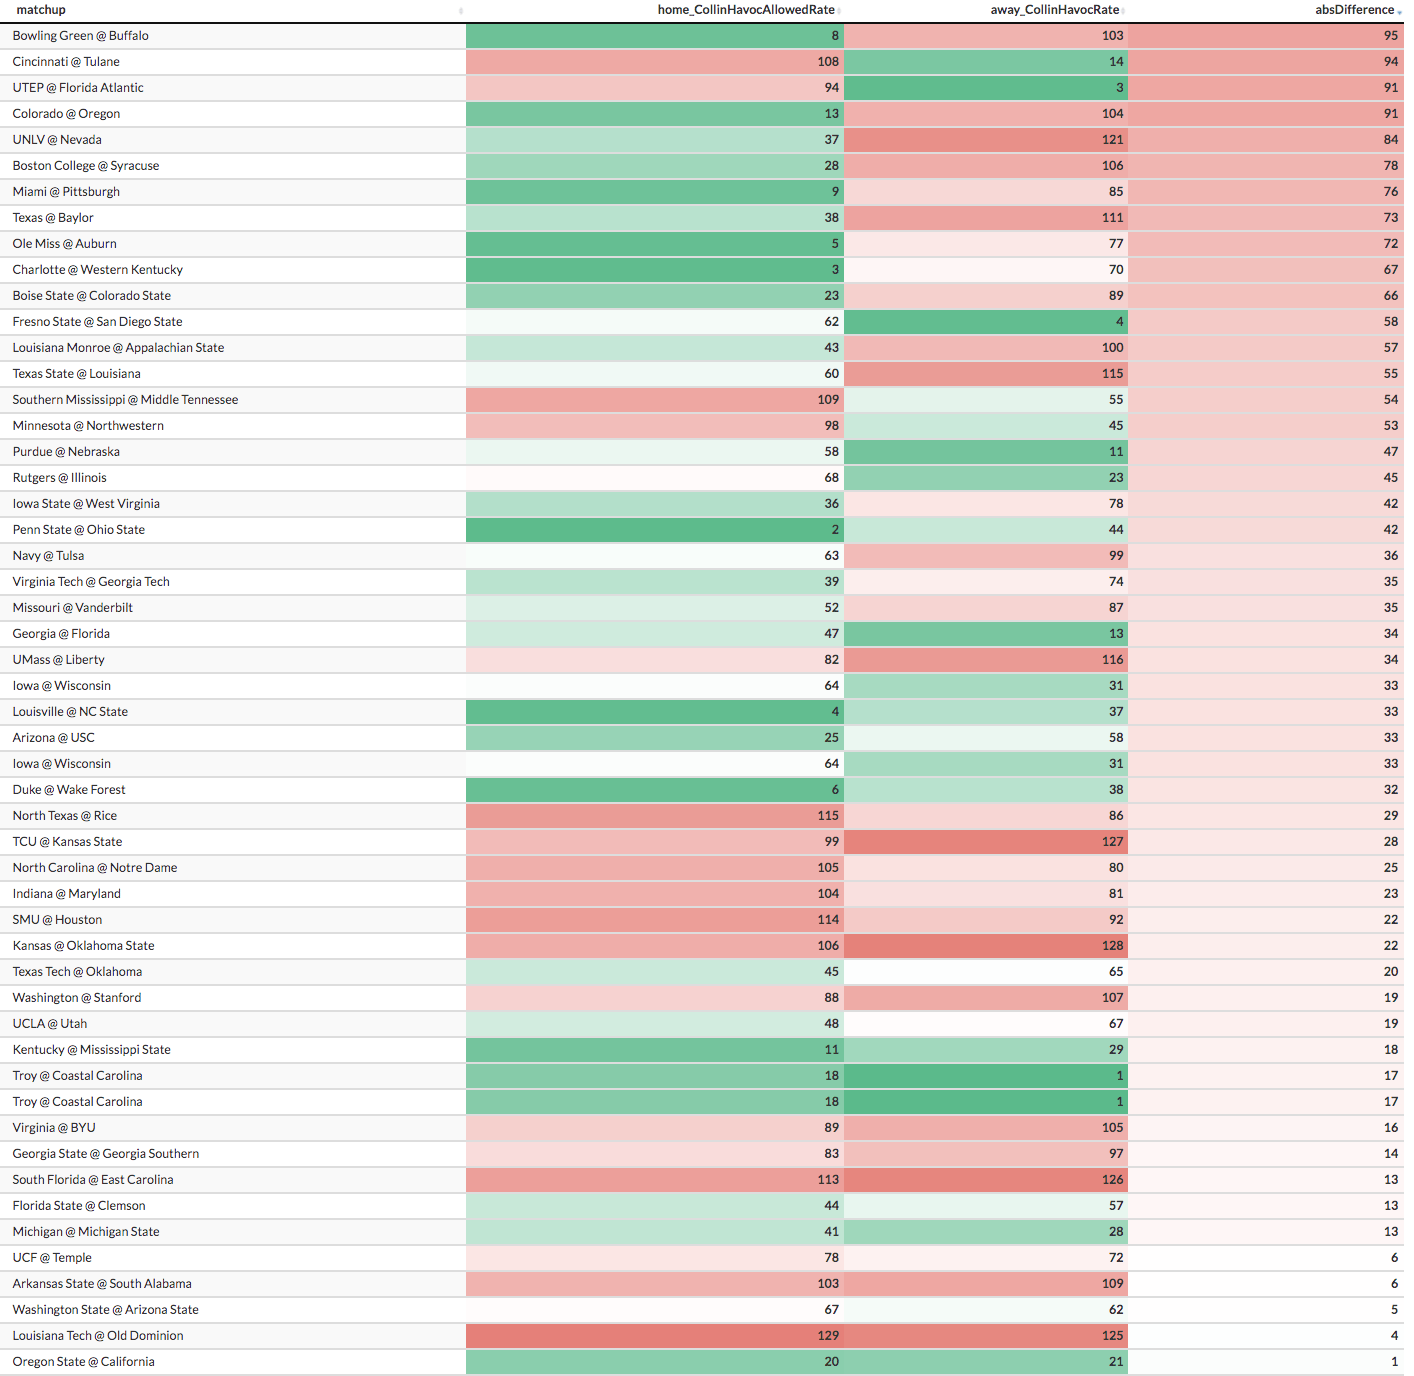
Home Team Havoc Allowed Rate vs. Away Team Havoc Rate
Biggest Mismatches
- Buffalo's offense vs. Bowling Green's defense
- Cincinnati's defense vs. Tulane's offense
- UTEP's defense vs. FAU's offense
Finishing Drives
What is Finishing Drives?
Finishing Drives is points per opportunity when the offense passes its opponent's the 40-yard line. Defensively, this is how many points per opportunity a defense allows when the opposing offense crosses the 40-yard line.
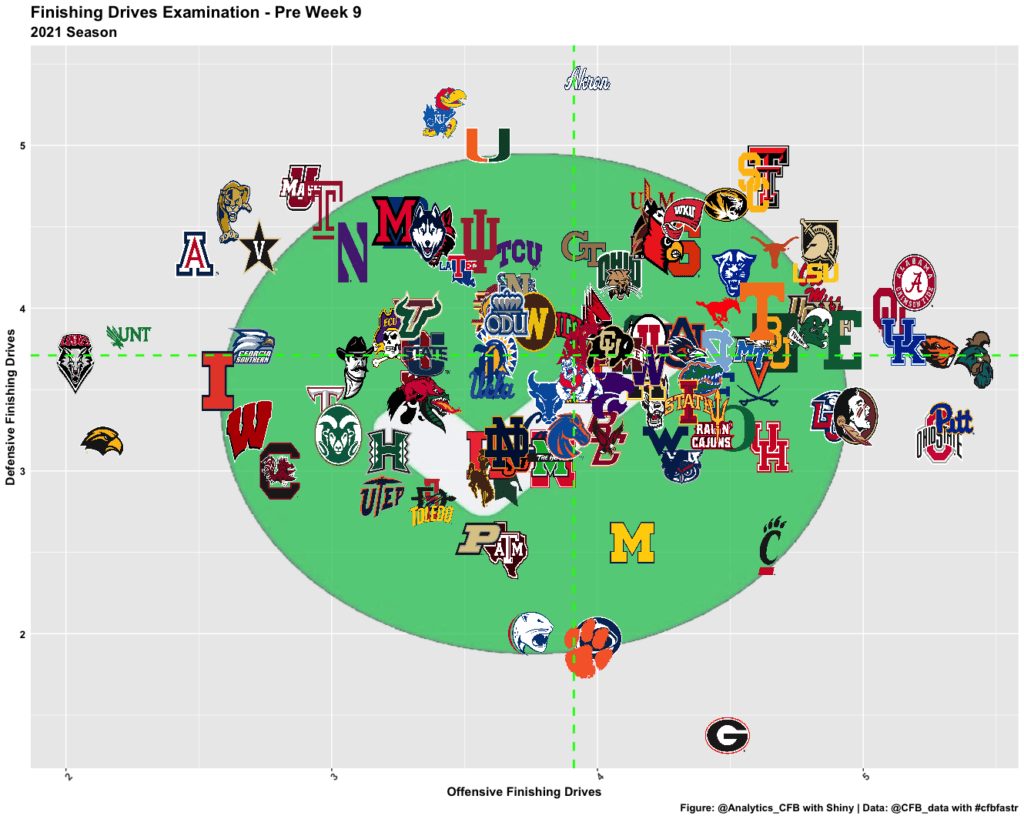
Offensive Finishing Drives vs. Defensive Finishing Drives
General Notes & Observations
- Georgia is allowing opposing offenses less than 1.5 points per trip inside the 40. For those unaware, that is historically good.
- Why is Mizzou 0-7 ATS this season? Well, not being able to stop anyone when they cross the 40 is a bad start.
- South Alabama, you killed us last week, but that defense is still looking strong.
- Wisconsin was looking pretty good on the Havoc chart — not so great here. That's why it's so important to look at multiple metrics before placing wagers.
Home Team Offensive Finishing Drives Rank vs. Away Team Defensive Finishing Drives Rank
Biggest Mismatches
- Pittsburgh's offense vs. Miami's defense
- Oklahoma's offense vs. Texas Tech's defense
- Liberty's offense vs. UMass' defense
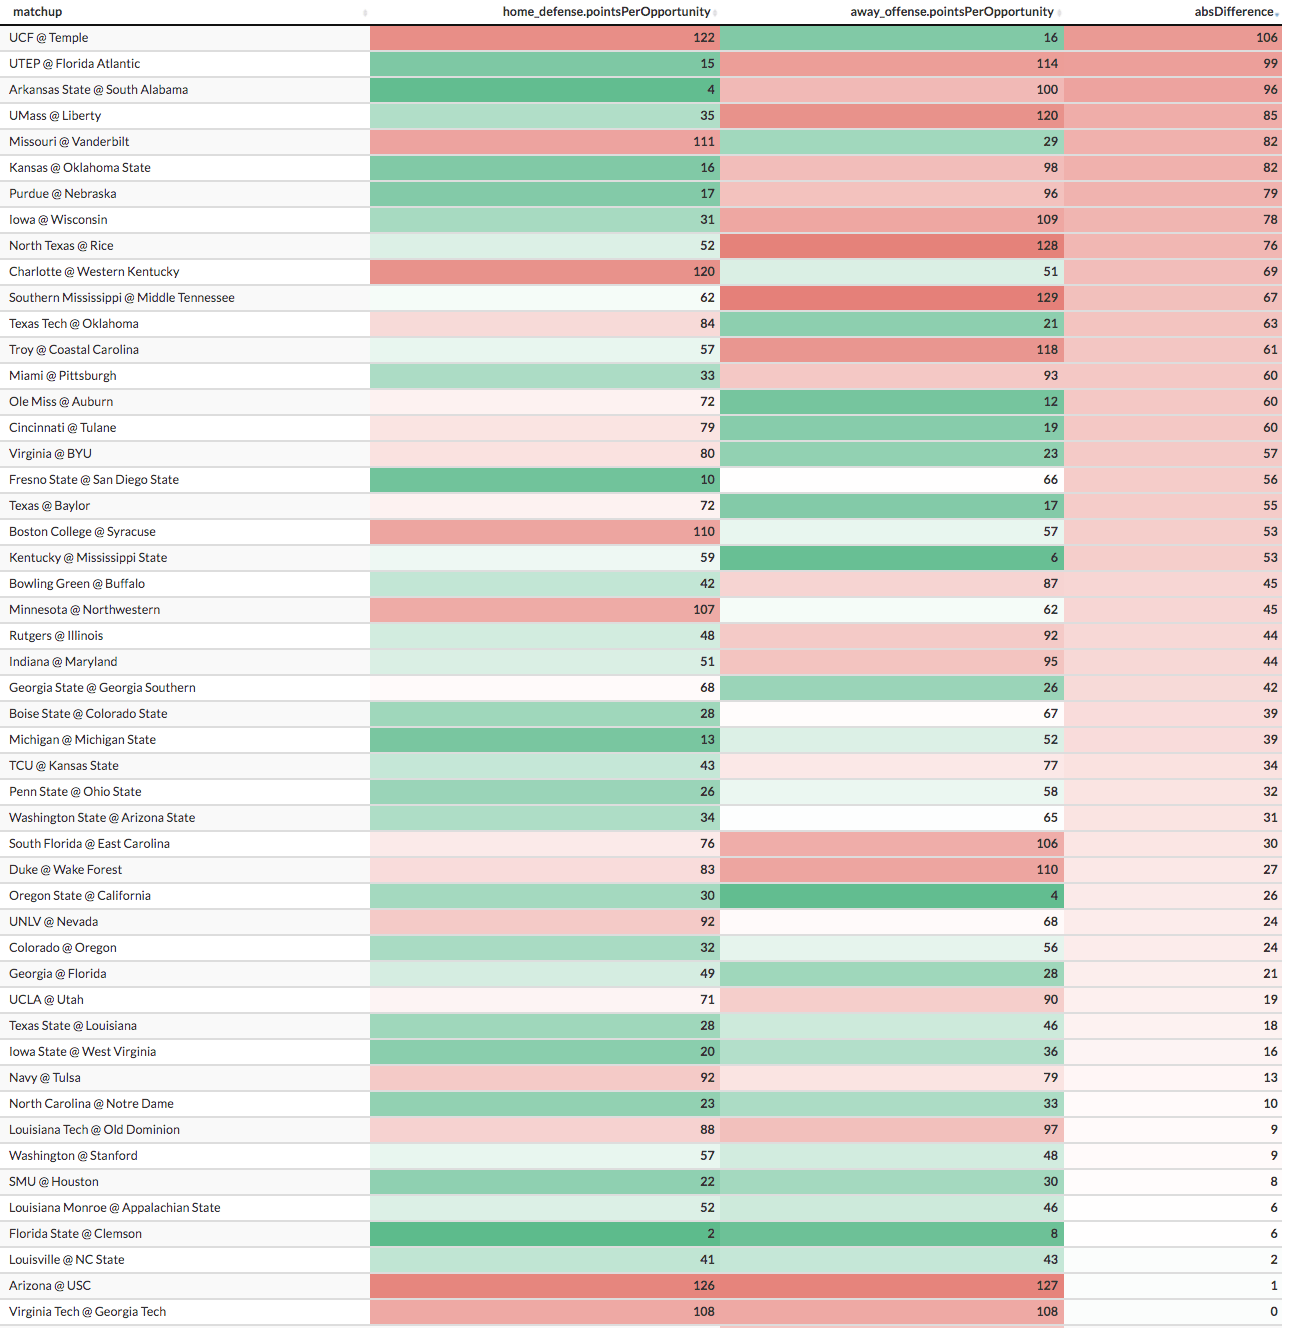
Home Team Defensive Finishing Drives Rank vs. Away Team Offensive Finishing Drives Rank
Biggest Mismatches
- UCF's offense vs. Temple's defense
- FAU's defense vs. UTEP's offense
- South Alabama's defense vs. Arkansas State's offense
Success Rate
What is Success Rate?
Success Rate is an advanced metric in football that measures efficiency, but with the important context of down and distance considered.
A play is defined as successful if:
- It gains at least 50% of the yards required to move the chains on first down
- 70% of yards to gain on second down
- 100% of yards to gain on third or fourth down
To calculate Success Rate, simply divide the number of successful plays (as defined by down and distance above) by total plays.
This definition is straight from our article on Success Rate. So, which teams excel at moving the chains?
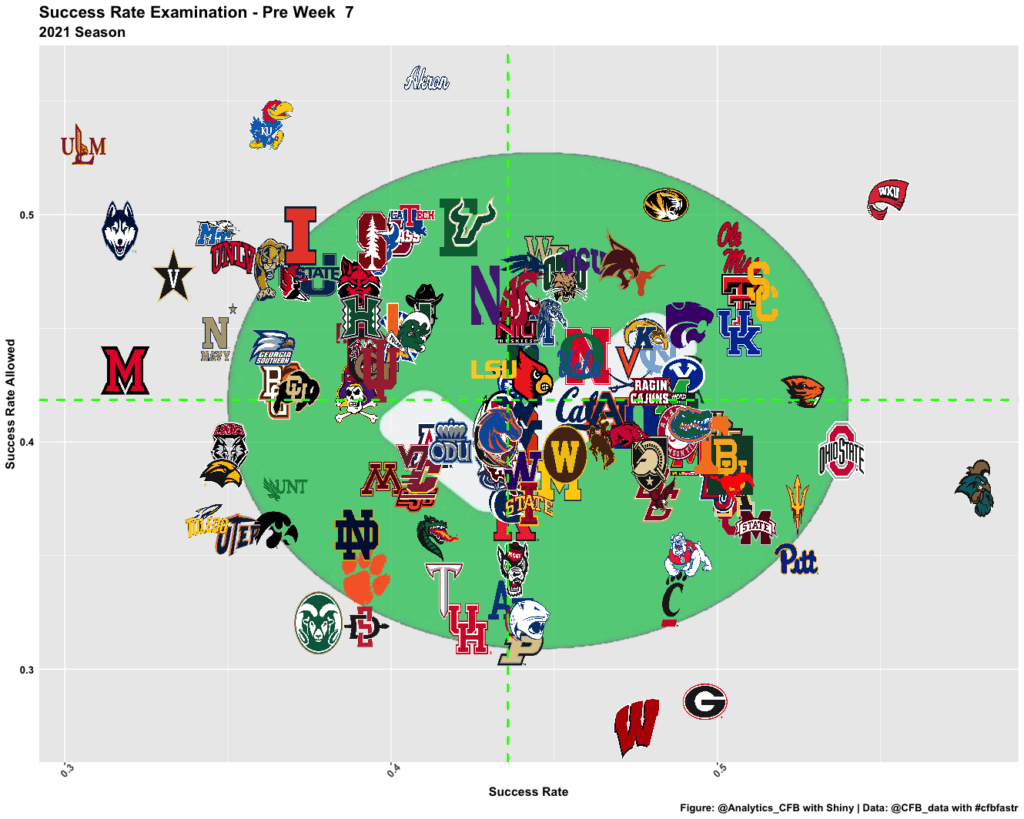
Offensive Success Rate vs. Defensive Success Rate
General Notes & Observations
(Once again, top left is bad and bottom right is good!)
- If Wisconsin could figure out how to get skill position players on offense to be not terrible, it'd be a Big Ten contender.
- Oregon State is putting together a very solid season from an advanced metrics perspective. Head coach Jonathan Smith is doing an impressive job this season.
- Alabama is very middle-of-the-pack.
- USC doesn't look terrible on this chart. Good for the Trojans!
Home Team Success Rate vs. Away Team Success Rate Allowed
Biggest Mismatches
- Louisiana's offense vs. Texas State's defense
- Kansas State's offense vs. TCU's defense
- App State's offense vs. ULM's defense
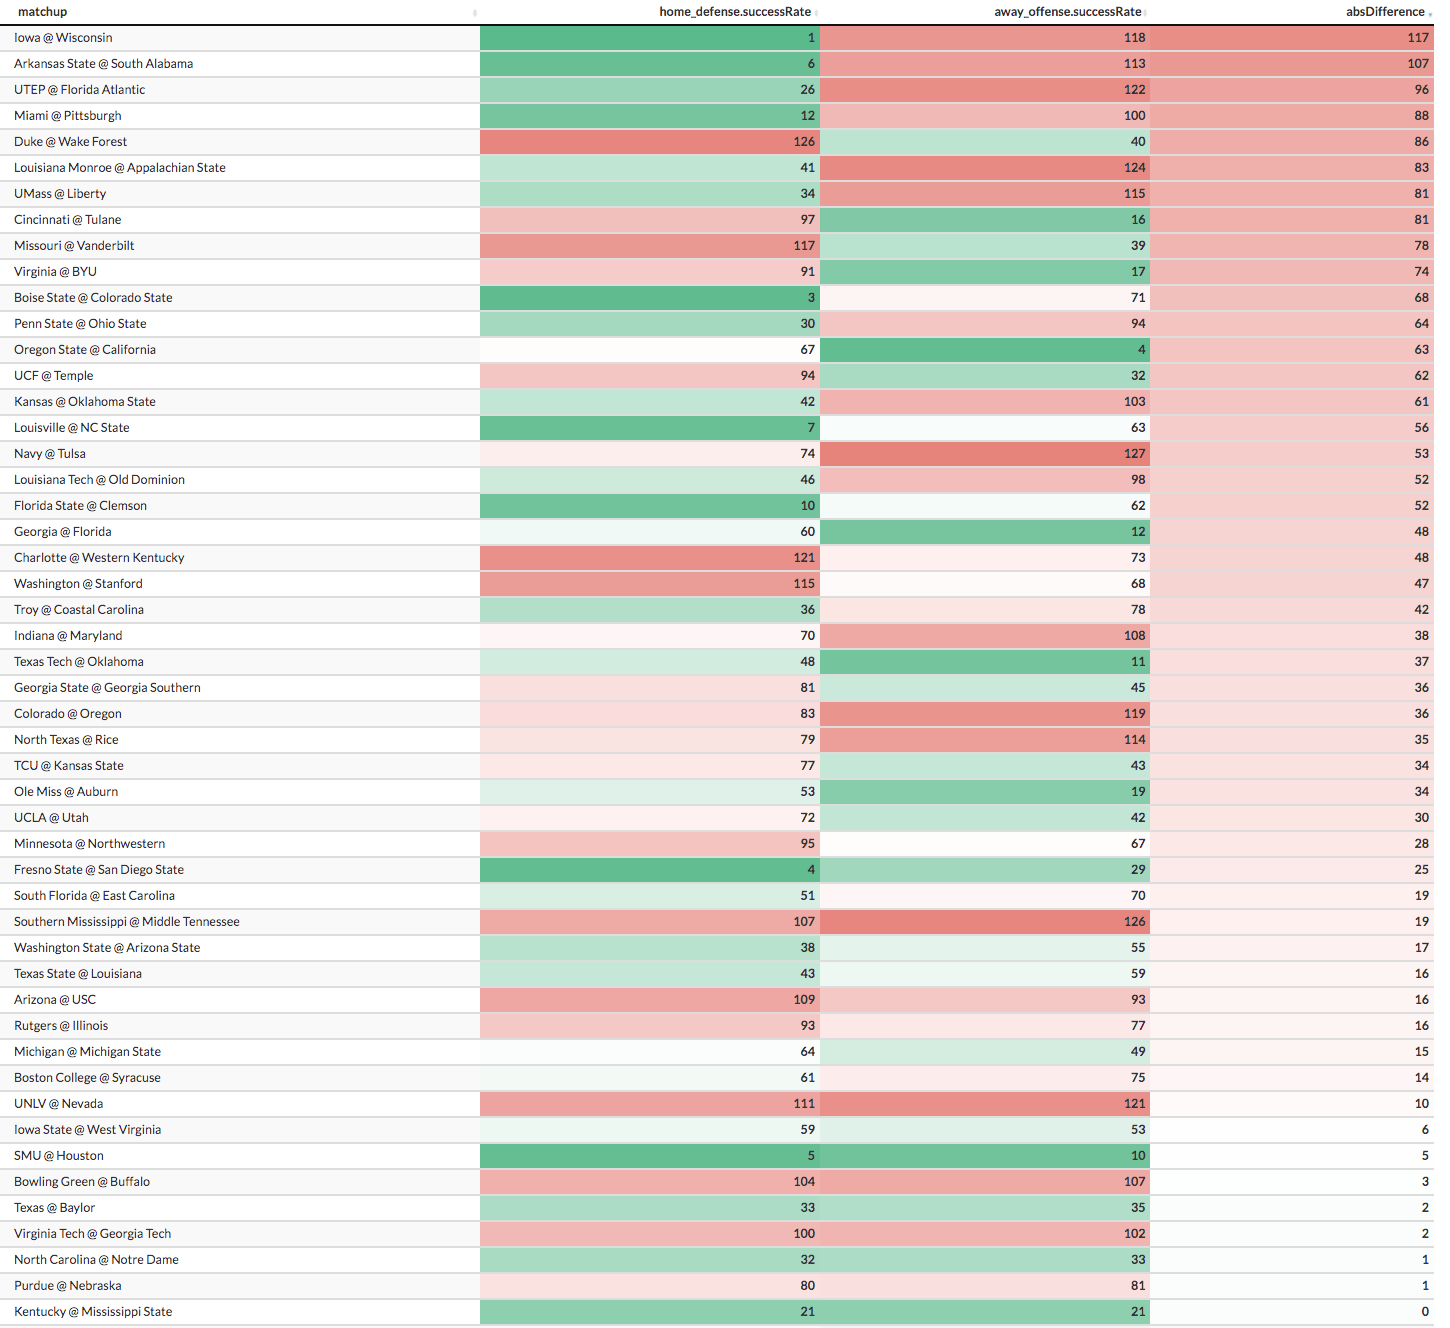
Home Team Success Rate Allowed vs. Away Team Success Rate
Biggest Mismatches
- Wisconsin's defense vs. Iowa's offense
- South Alabama's defense vs. Arkansas State's offense
- FAU's defense vs. UTEP's offense
Explosiveness
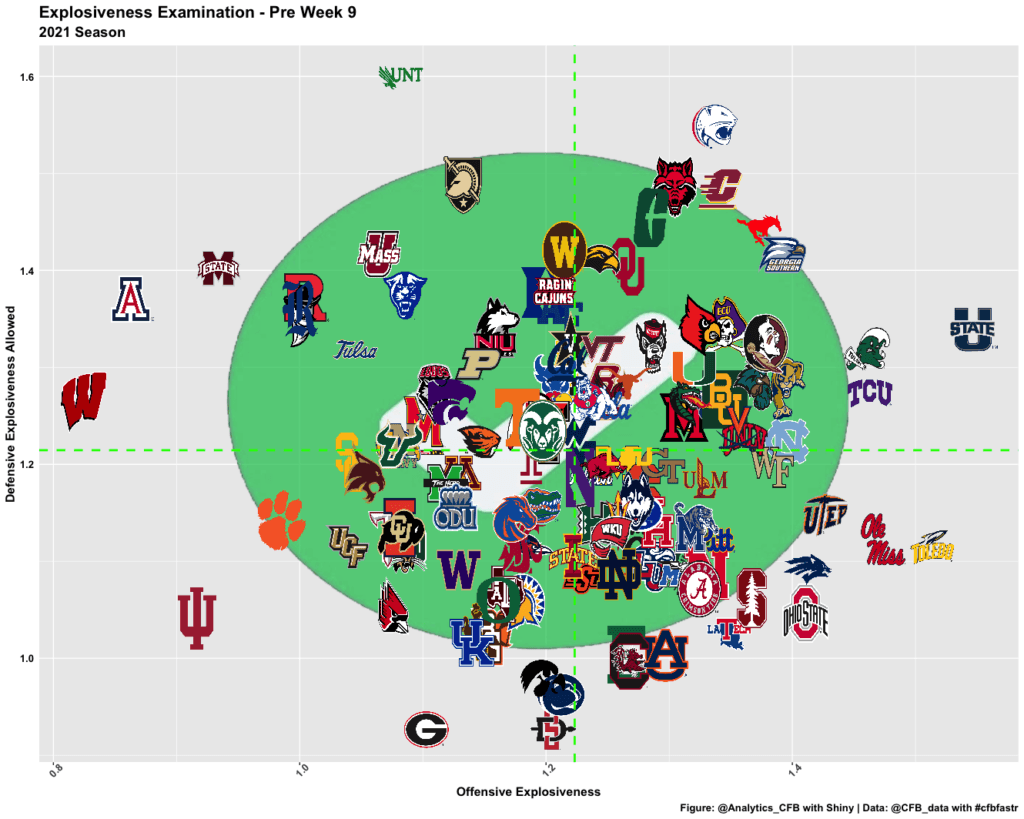
Per College Football Data (CFBD), Explosiveness measures the average EPA on plays that were marked as successful. We are using this definition since we are using their metrics.
General Notes & Observations
(Once again, top left is bad and bottom right is good.)
- You do not normally see Mike Leach-coached teams in the bottom-five of offensive explosiveness.
- Clemson, what are you doing with your five-star quarterback?
- Penn State's defense is playing very well this year.
- An Oklahoma-Georgia playoff game would be a very entertaining matchup of offense vs. defense.
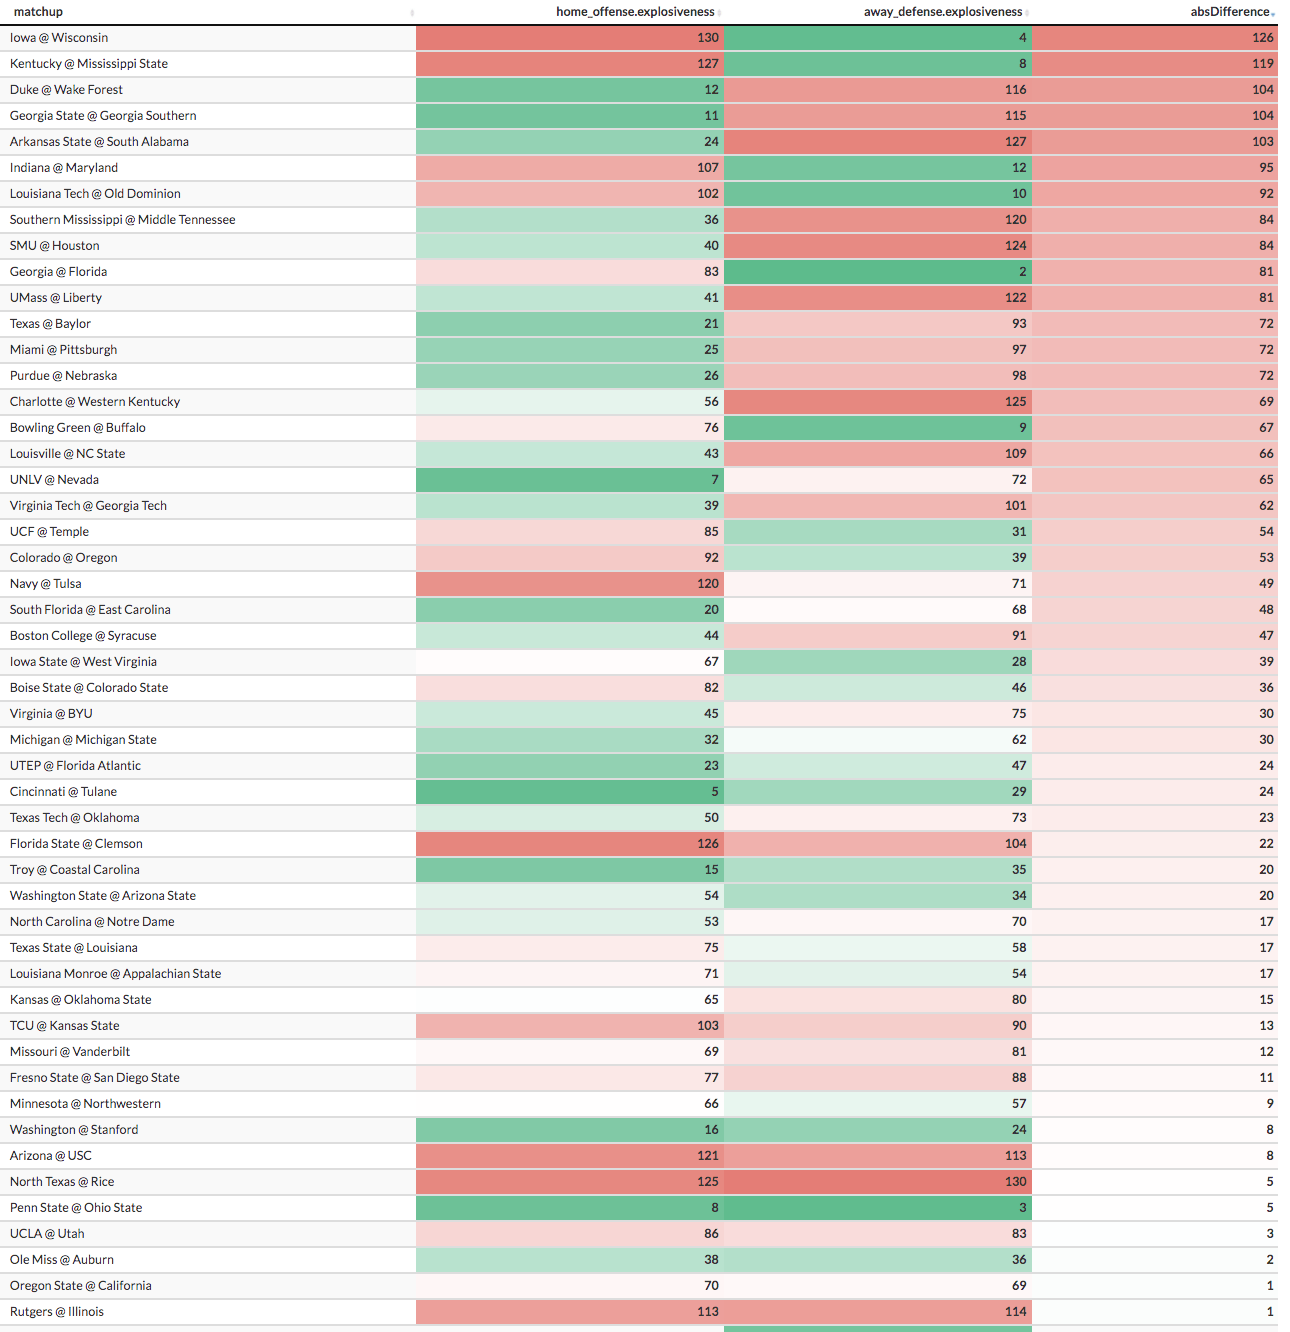
Home Team Explosiveness vs. Away Team Explosiveness Allowed
Biggest Mismatches
- Iowa's defense vs. Wisconsin's offense
- Kentucky's defense vs. Mississippi State's offense
- Wake Forest's offense vs. Duke's defense
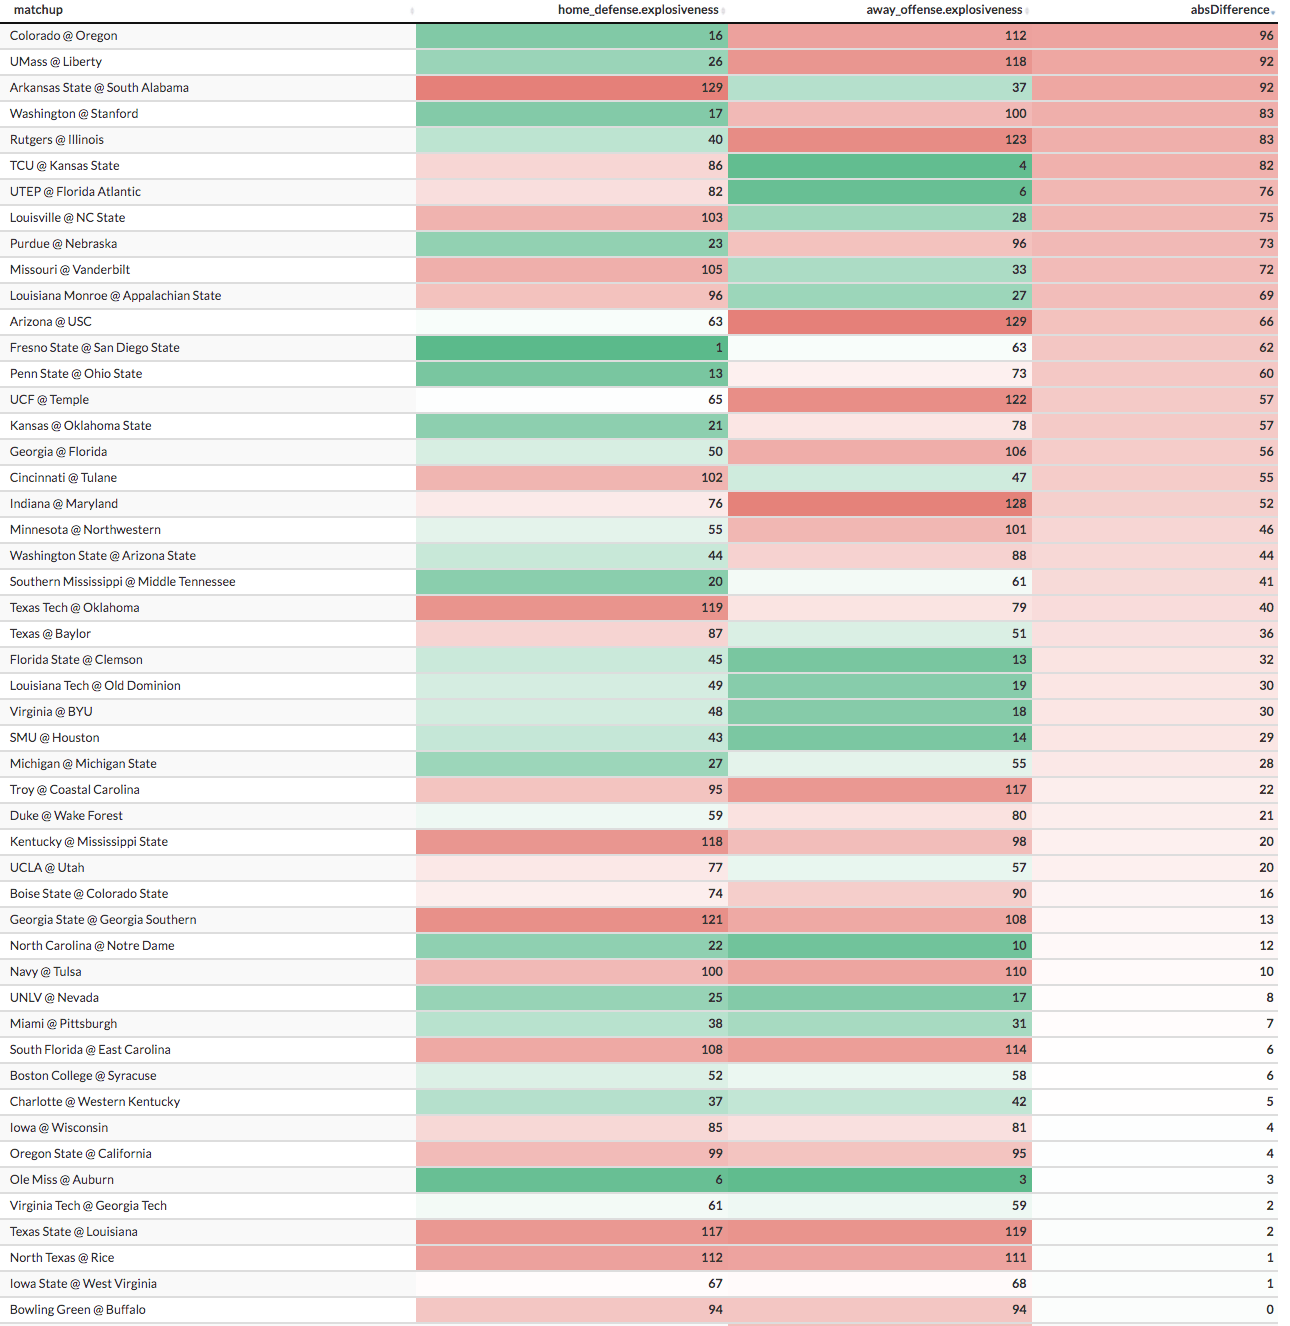
Home Team Explosiveness Allowed vs. Away Team Explosiveness
Biggest Mismatches
- Oregon's defense vs. Colorado's offense
- Liberty's defense vs. UMass' offense
- Arkansas State's offense vs. South Alabama's defense
Week 9 Betting Takeaways
Congratulations on finishing this article (it can be a little dense), but now that you're here, it's time to reap the rewards. Based on these charts, what edge can we gain against the books?
Over our last three picks, we've gone 2-1, and all have been against the spread.
Let's change it up a bit and target a total.
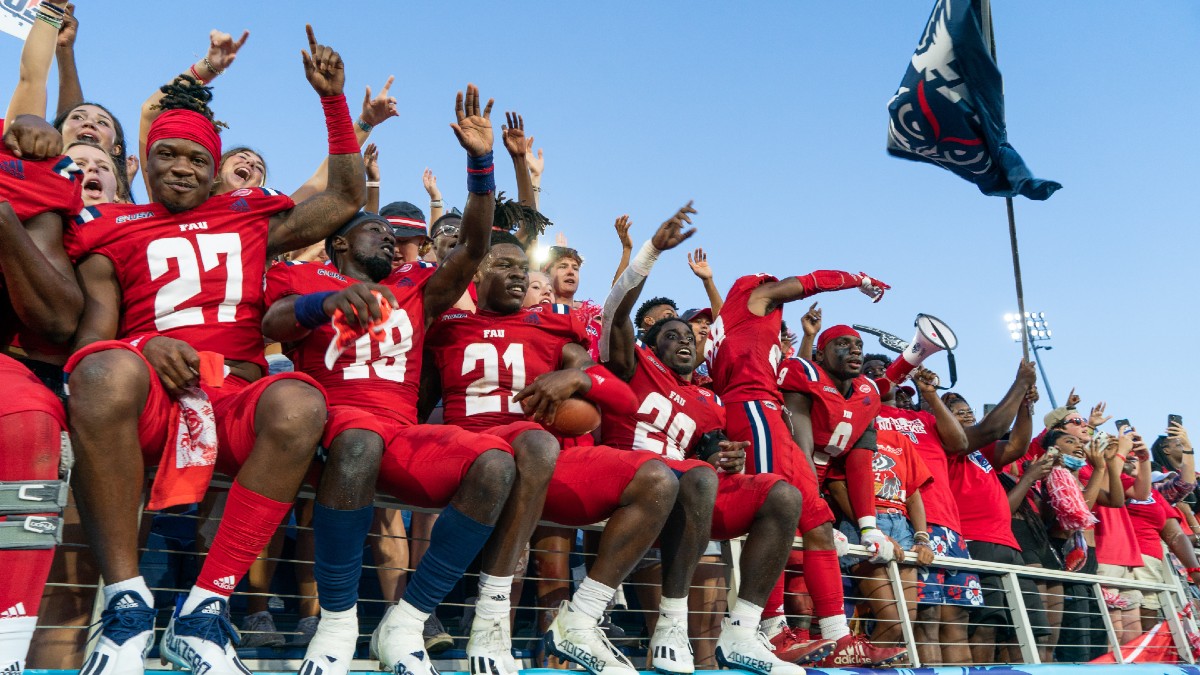
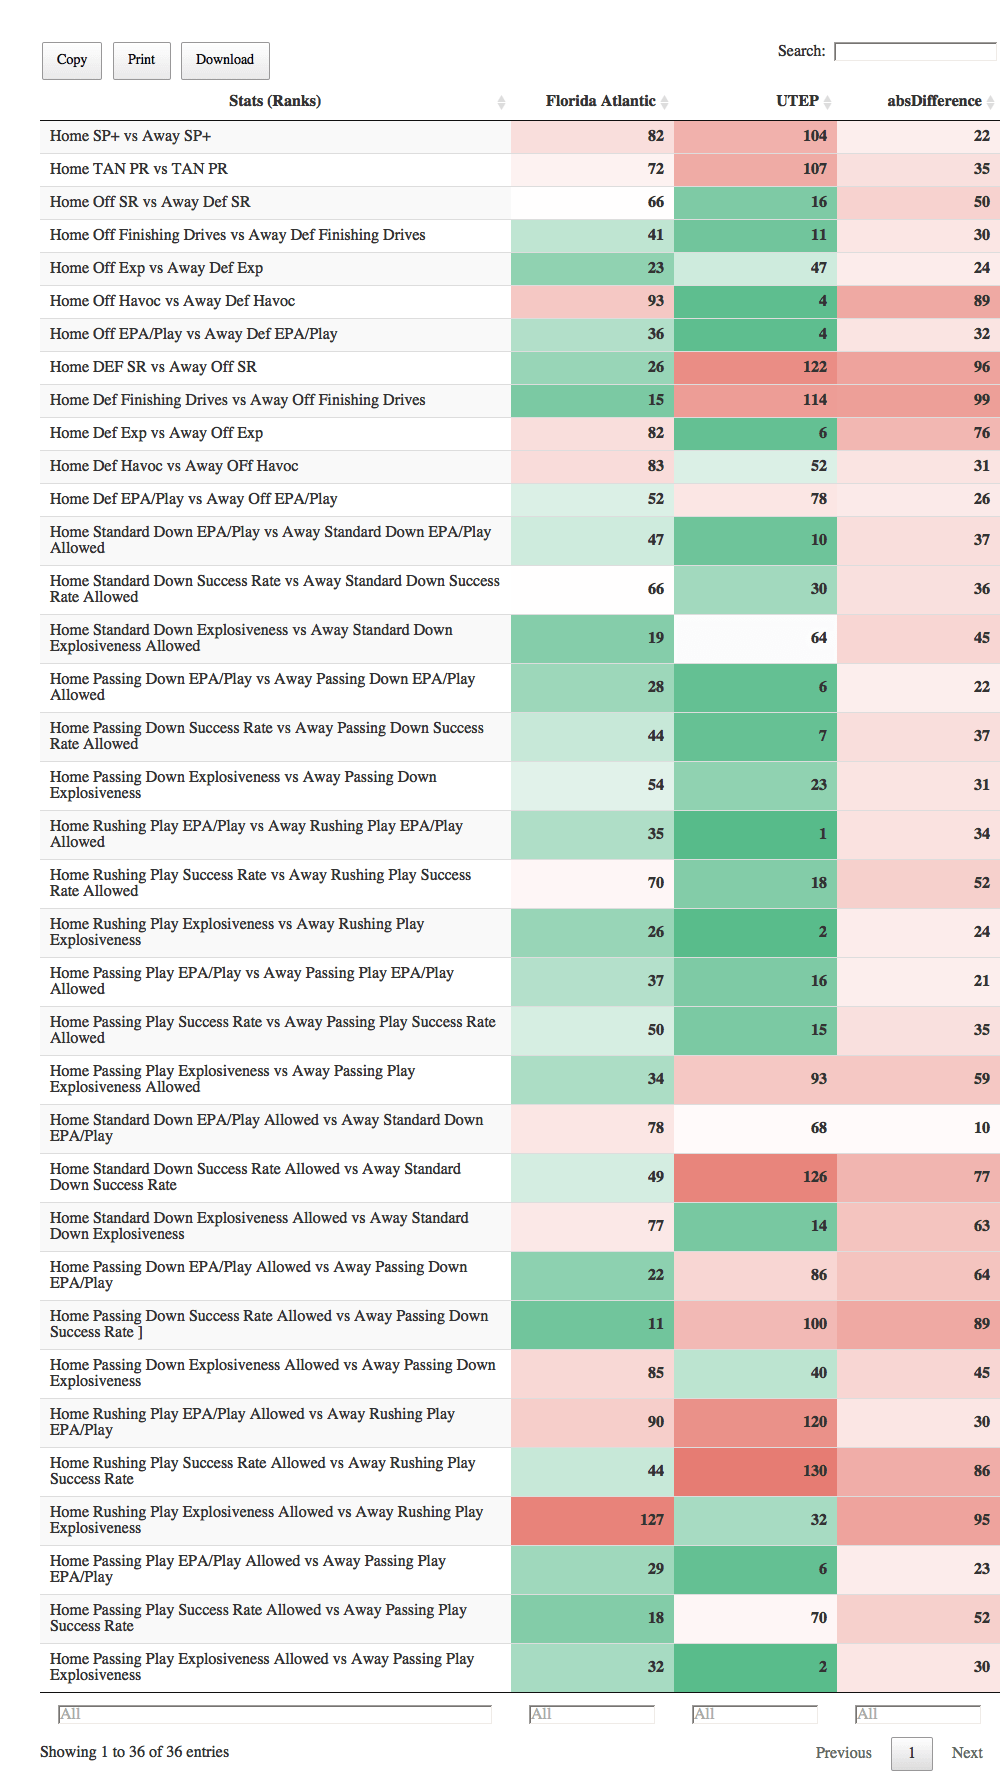
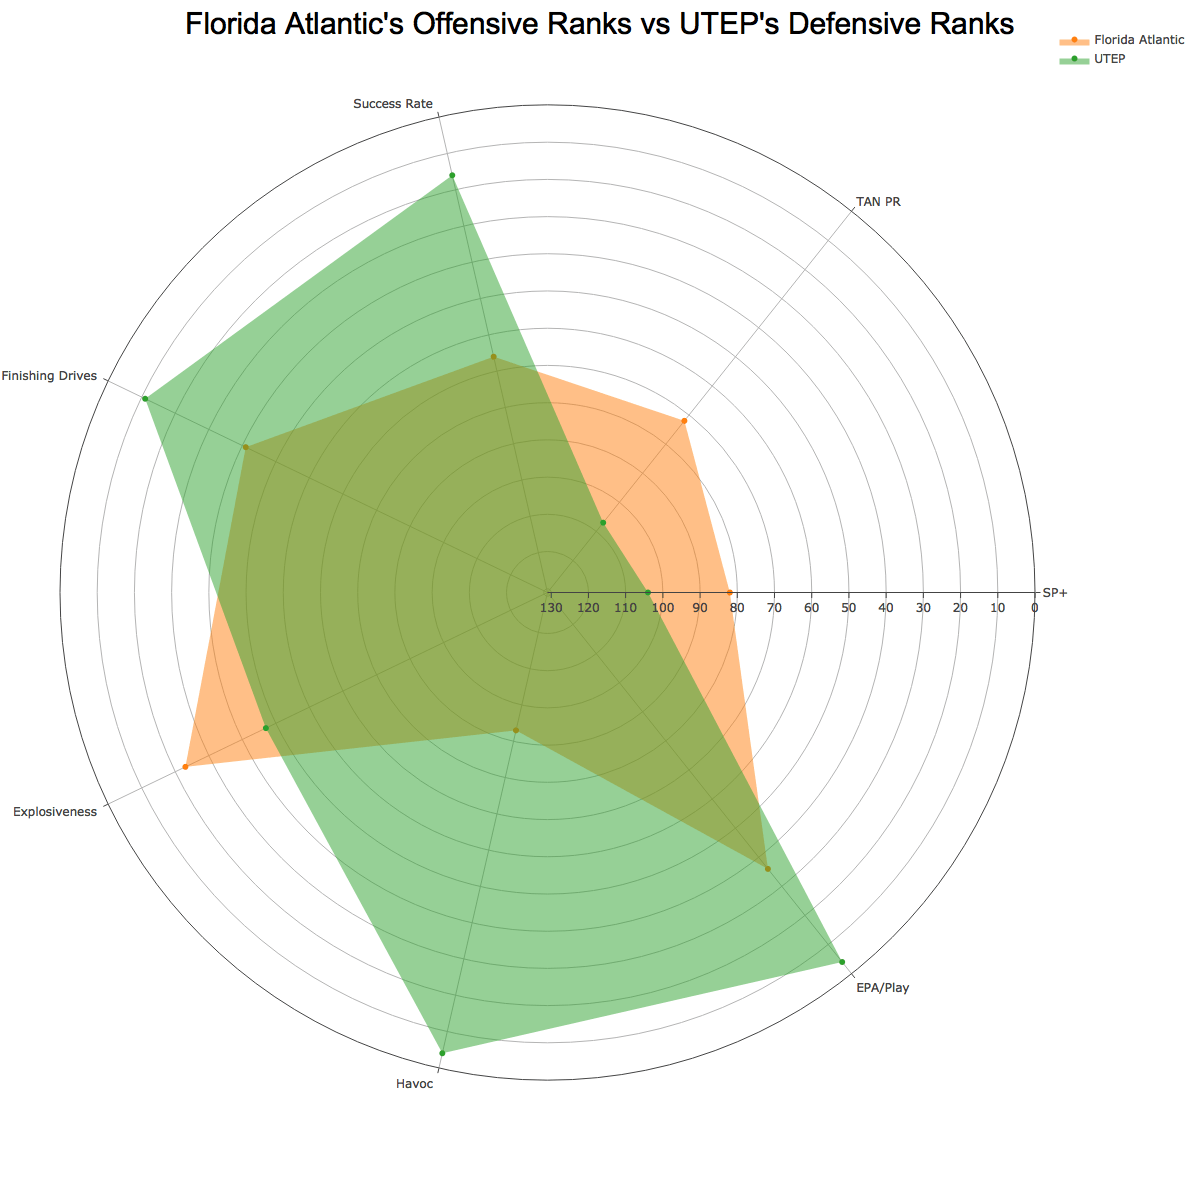
The game that caught my eye is UTEP at FAU. Let's take a little bit closer look at this game:
What am I seeing here? Both defenses are much better than their opponent's offense, particularly in Success Rate and Finishing Drives.
This will likely be a game with a lot of stalled drives, which is an under bettor's dream.
This total has been steadily creeping up, so if you can grab 49, pounce. But I would be comfortable with 48.5 here. But if you can find a book that lets you buy up to 49 at -120, go with that Saturday if you can't find a 49 anywhere else.


