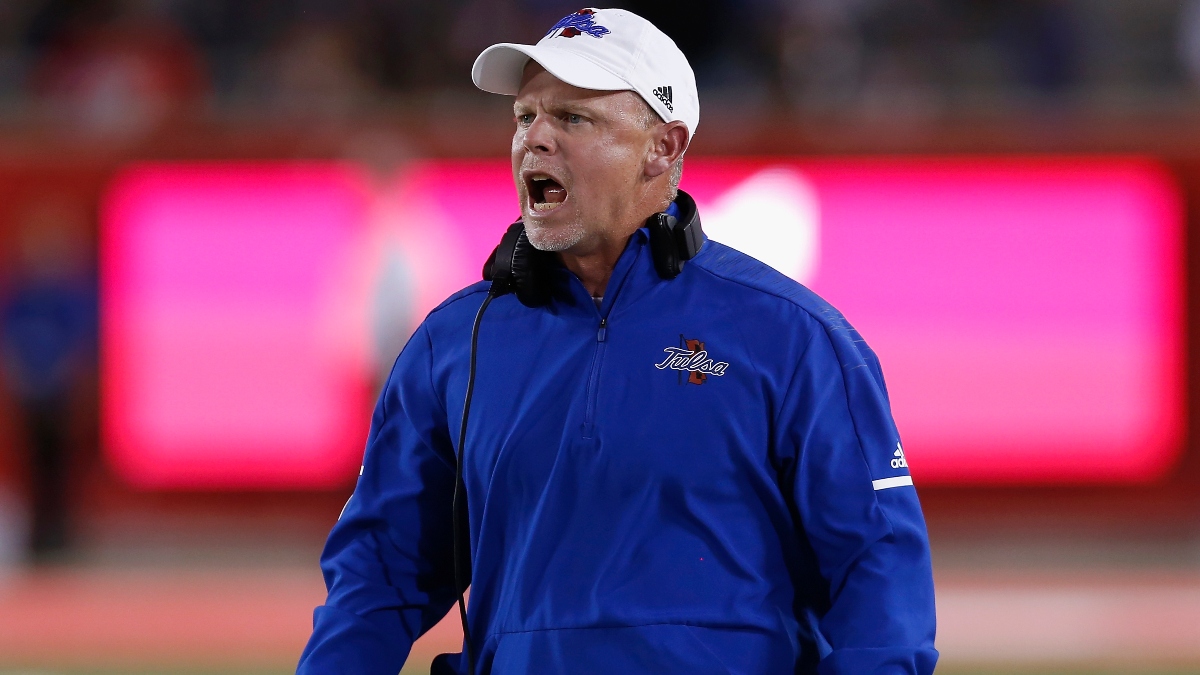
One of the biggest underdogs to cash over the weekend came at the defeat of Central Florida. Philip Montgomery was known as the quarterbacks coach at Baylor when Robert Griffin III made his way through Waco, and he left before the 2015 season for the Tulsa job, ultimately struggling to field a defense in Conference USA since a 10-win year in 2016.
The Golden Hurricane pulled off the upset in Week 5 thanks to the Havoc-led defense, led by coordinator Joseph Gillespie. Linebacker Zaven Collins was a one-man wrecking crew in the victory over Central Florida.
.@TulsaFootball LB @ZavenCollins was all over the field this weekend, finishing with a team-high 10 tackles, 3.5 tackles for loss, an interception, and two pass breakups. #AmericanPow6rpic.twitter.com/A9AsIwV1Qi
— American Football (@American_FB) October 5, 2020
Our Havoc column will look at the defensive Havoc and offensive Havoc allowed each week. The calculation is simply a cumulative number of tackles for loss, interceptions, fumbles and passes defensed divided by the number of plays on both sides of the ball.
Don't forget to check out the updated Power Ratings and follow me in The Action Network App to see when I bet on games that have the biggest Havoc discrepancies.
Check out our new NCAAF PRO Report, where we highlight factors that provide betting edges — like large wagers, historically profitable betting systems, model projections and expert picks — that when combined with sharp money can powerfully detail the smartest bets on a given slate.
Week 6 Havoc
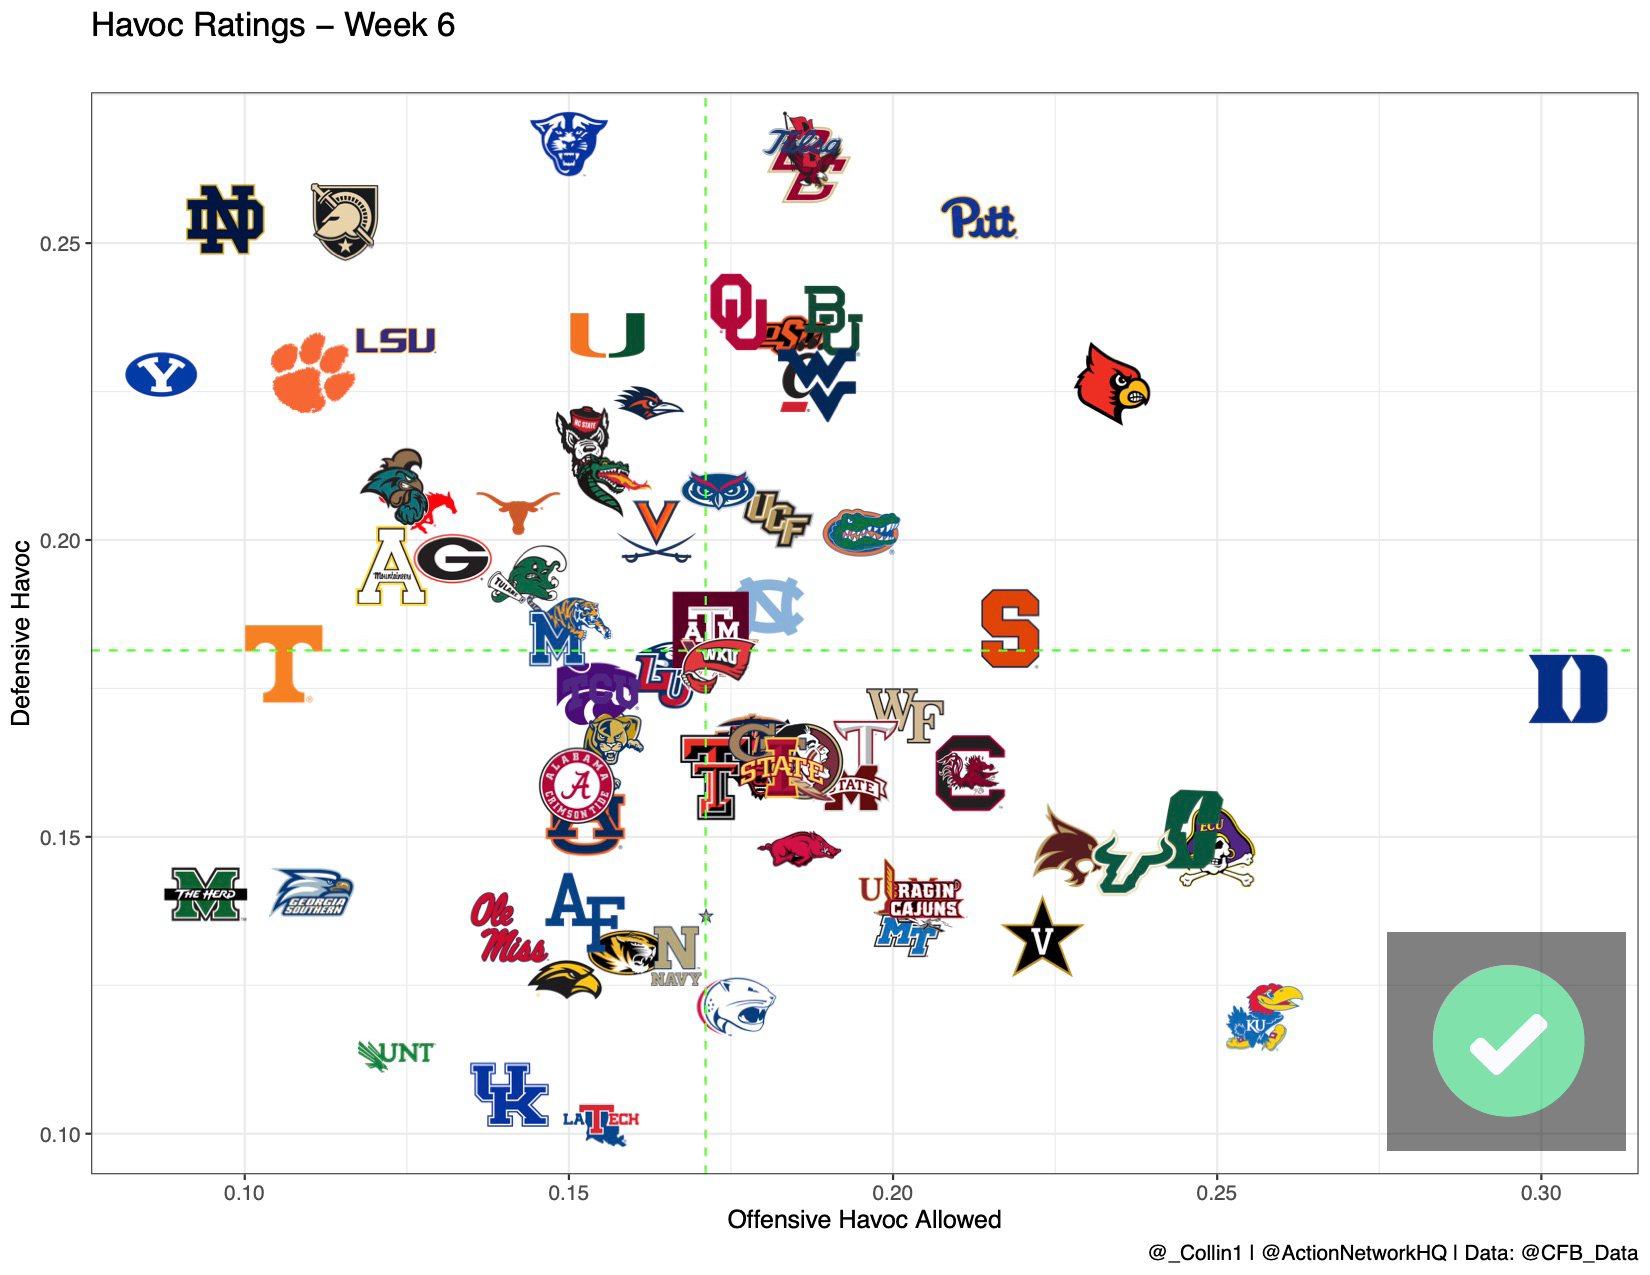
Teams strive to be as far to the top left of the chart as possible. A high level of offensive interceptions, fumbles and tackles for loss allowed results in a high mark of Offensive Havoc. The chart above with stats provided from collegefootballdata.com, takes into account quarterback hurries.
Louisville continues to feature an offense that gamblers cannot trust in terms of havoc allowed, already guilty of giving up a whopping 32 tackles for loss. While Pittsburgh may field the most ferocious havoc-minded defense in the conference, the Cardinals are the worst in the nation on offense at preventing chaos.
Remember, the visualization includes quarterback hurries, which can vary. The chart above are raw havoc numbers that give a gambler a general idea defensive greatness and offensive fraudulence. Here are a few notes on havoc for Week 6:
- Marshall has fielded an offense that investors can rely on for stability. The Herd has allowed just three tackles for loss, no fumbles and just one interception. Western Kentucky ranks in the middle of active FBS teams in defensive havoc, but the Hilltoppers do average close to seven tackles for loss per game.
- The top team in the nation in havoc allowed is BYU, with just 12 tackles for loss through 217 offensive plays. That will be put to the test for the first time this season against UTSA. The Roadrunners are the top team in the nation in tackles for loss.
- Based on havoc alone, Syracuse is worth a play as an underdog against Duke. The Orange have compiled 20 tackles for loss through three games and now get a Blue Devils team that has allowed the second-most tackles behind the line of scrimmage. Syracuse is also top 20 in defensive finishing drives, which will make scoring chances even tougher for a Blue Devils team that needs a lifeline.
Terms to Know
Postgame Win Expectancy is a calculation of all variables in a box score that dictate who would win the game if it was played a high number of times. Turnover luck, success rate and yards per play are notable components of this calculation and can influence a single game. But over a large sample, the team that moved the ball better would win more often than not.
There have been plenty of box scores in which a team wins as an underdog, but a negative value is applied to that team's power rating because the result was fluky rather than systematic.
Coach scheme changes can adjust a power rating quickly. For example, Oregon will undergo a change from Marcus Arroyo's conservative play-calling to new offensive coordinator Joe Moorhead's system. Moorhead's offense features a heavy dose of 11 personnel, West Coast spread concepts and modern run-pass options.
That offensive philosophy has led to more explosiveness and higher rates of success on standard downs at each of Moorhead's previous stops at Penn State and Mississippi State. In a situation like this, a power rating can be useful to quickly adjust a team's forecast for future games. In the case of Mike Leach, an adjustment of totals is coming with an increase in plays per game.
Success Rate and Explosiveness were first defined in Bill Connelly's Five Factors and are strong indicators for future box scores. While EPA (Expected Points Added) and IsoPPP (Isolated Points Per Play) can be highly variable from season to season, Success Rate is a stable data point for handicappers to use for projections.
Simply put, if a team consistently achieves the desired amount of yards — determined by down and distance — then this is a "play-on" team with your bankroll. Texas A&M ranked 17th in offensive success rate last season and returns 80% of its offensive production for 2020; that combination makes the Aggies a play-on team.
As Week 6 approaches, we'll be keeping track of all these variables in and out of the box score. Be sure to bookmark our power ratings for the latest update on all FBS and FCS teams playing this fall.


