


If you want more Action Network content, be sure to add us as a preferred source on Google.
Hi! I’m Sean Zerillo, Action Network's Senior MLB Analyst, and this is Opening Pitch, my daily baseball betting column, which highlights my top projected edges via our new PRO baseball betting tool, B.A.R.T.O.L.O.
Below, you can check out today’s projected scoreboard and then click on any game to see an in-depth statistical breakdown of that matchup.
With B.A.R.T.O.L.O., you can:
- Get direct access to the live data used to generate our Action PRO Projections
- Find betting edges and generate CLV before the market moves toward the projected line
- Do your own research and find your own best bets with all the advanced statistical information presented in a clean and easily digestible way
- Access my team futures model (win totals, divisions, playoffs, and World Series) and my player awards model (MVP, Cy Young, Rookie of the Year), which both update daily
Overall, it’s a data visualization tool I created to make researching and finding bettable edges easier for our PRO subscribers.
World Series Futures, Props, and MVP
Series Price and Team Props
I make the Brewers nearly 92.5% favorites (-1232 implied odds) to win the World Series prior to Game 5, and I'm once again a bit more optimistic than public projections from The BAT X (91.1%), FanGraphs (90.1%), OOPSY (89.7%), and ATC (89.2%).
I project a very slight edge on both the Brewers' series price and their -1.5 games spread (projected -474, listed -430), but I show a more significant edge on their Game 5 moneyline.
World Series MVP
What makes a World Series MVP?
I dug into data going back more than 50 years to see what has mattered previously (beyond playing for the winning team, unless you are Bobby Richardson) and to determine whether the 2026 field shows any potential signal.
I did not find a link between winning MVP and regular-season quality: once you account for what a player did in the series, his regular-season OPS carries a slightly negative coefficient; no provable bias toward star players. I did not find a hot-hand effect either: a team’s two hottest bats entering the World Series have won it 6 times; almost exactly their share of the lineup. Here is what did show up:
- Stat Share: The highest correlating data points to MVP winners are 1) Share of team total bases; 2) Share of team RBI; 3) Share of team IP; 4) Share of team pitching wins. Among the 39 hitters who won it, 69% led their team in hits, 69% in home runs, and 56% in RBI, and each was in the top three on his team in at least one of the three categories.
- Batter Opportunity: As a result, a hitter in the top three spots of the team’s order has won MVP 8.9% of the time, the 4-5-6 hitters 7.9%, and the 7-8-9 hitters 5.8%.
- Longer is Better for Aces: Pitchers have been the MVP in seven-game series 42% of the time, compared to 24% in six games or fewer. A third opportunity for a quality appearance by a starter isn't necessary, but it's seemingly the clearest path to victory when it does happen
- Pitchers Carry "Underdogs": When the team with the worse regular-season record has won the World Series (home-field rules have changed over time), the MVP has been a pitcher 50% of the time (14 of 28), vs. 11% (3 of 28) when the better record prevailed.
Before Game 4, I recombined relevant statistical data points with forward-looking series prop and leader markets as a projection proxy to identify players expected to perform well who may not be appropriately priced on the MVP board.
I added small MVP bets on both Jackson Chourio and Cooper Pratt during Game 4, prior to the Rays' come-from-behind win.
My model made Pratt a 57% favorite after his go-ahead home run, before Jackson Chourio doubled in the same inning. After the Chourio double – which tied Babe Ruth's 98-year-old record for hits (10) through four World Series games – I made him the favorite once again, and I positioned myself to profit the same amount whether Chourio or Pratt had won.
Chourio leads the field in hits, total bases, runs, and steals, while Pratt leads the series in RBI and has generated the most championship win probability added among position players.
I think Chourio is fairly valued before Game 5, but I would recommend taking Pratt at +750 or better. 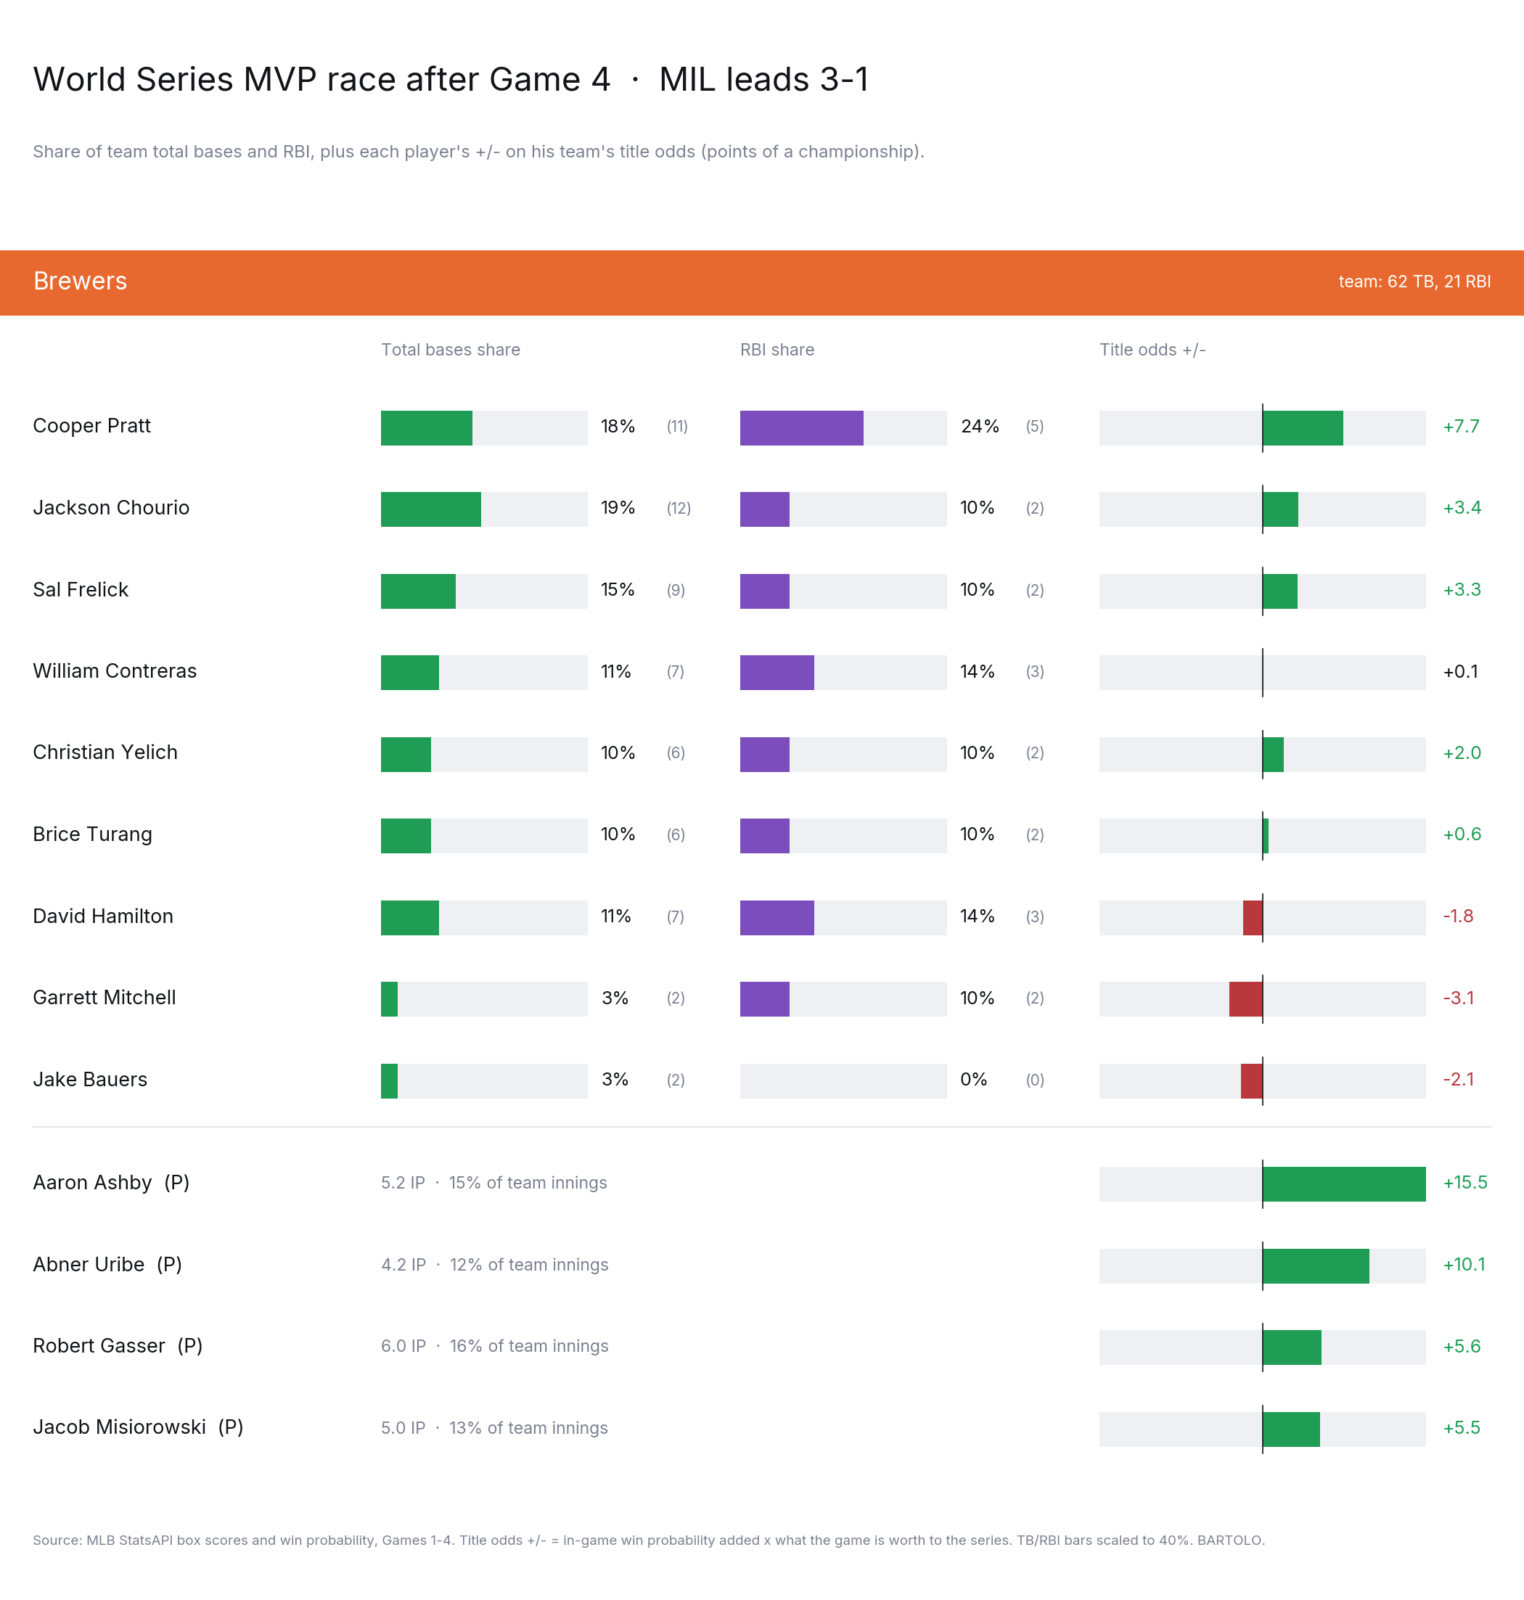
Aaron Ashby has generated the most championship win probability among all players in the series, but will get surpassed in innings by Game 5 starter Jacob Misiorowski.
"The Miz" has a chance to earn a second win in this series, and if the presumptive NL Cy Young posts what would be an average regular-season pitching line for himself (5 2/3 innings, 3H 1 ER, 1 BB, 8 K) in a Game 5 win, he should get back into the mix for MVP honors.
Take Pratt to +750, and Misiorwski down to +2500 prior to Game 5.
Follow me in the Action Network App for additional bet notifications.
Today's Projected Scoreboard
Below are B.A.R.T.O.L.O.'s full MLB projections for Wednesday, October 28.
Click on any game to see an in-depth statistical breakdown of that matchup.


