We've all had enough bad beats to understand that the final score does not always do the best job of reflecting each team's performance. This weekly column highlights matchups where the advanced box score tells a different story than the game's result. Sports bettors may want to keep this information in the back of their minds before placing next week's college football wagers.
Check out our new NCAAF PRO Report, where we highlight factors that provide betting edges — like large wagers, historically profitable betting systems, model projections and expert picks — that when combined with sharp money can powerfully detail the smartest bets on a given slate.
Deceiving Blowouts
These teams may have cruised to victories over the weekend, but the box score indicates that the game was closer than it appeared.
Cincinnati 28, South Florida 7
Cincinnati definitely deserved the win here, but the 21-point margin of victory may have been inflated. Anyone want to guess how this game started? Interception, interception, interception, fumble, punt.
There were a total of nine turnovers in this game, five of which were interceptions thrown by USF. Overall, Cincinnati had a success rate advantage of 40% to 33% and a yards per play advantage of 4.7 to 3.9. South Florida was abysmal when it came to finishing drives, as they only managed seven total points on seven trips past the Cincinnati 40-yard line. The Bulls were also unsuccessful on the high-variance downs, going 5-of-13 on third downs and 1-of-3 on fourth downs. Cincinnati was able to convert 58% of its third downs and was successful on its only fourth down attempt.
Again, the Bearcats deserved the win, but the game was closer than the final score would indicate. Surprisingly, this was a week where most of the blowouts were warranted, but this one deserved to be highlighted.
Puzzling Point Totals
Everyone knows the terrible feeling of holding an Over ticket, watching a team drive into the red zone and then witnessing that team fail to score a touchdown. Sometimes the total does not reflect the offensive efficiency that happened on the field.
SMU 30, Memphis 27
As someone who was holding a live Over ticket, I'm going to use this opportunity to complain about my loss. After combining for 44 points in the first half, SMU and Memphis managed a grand total of 13 points in the next half. Despite 7.6 yards per play for SMU and 6.4 for Memphis, as well as over 1,000 yards of total offense, the game never even sniffed the total of 74.5. We even got the pace of play we were looking for to cash the Over: Memphis ran 80 plays while SMU ran 72.
Turnovers absolutely played a factor in the final score, with each team losing two fumbles and Memphis adding another two interceptions on top of that. Turnovers ended drives of 51 yards, 75 yards and two drives of 35 yards. SMU also lost star receiver Reggie Roberson to a knee injury while he was running down the field on what should have been a long touchdown.
Tulsa 34, UCF 26
Don't let the 60-point total trick you into thinking these offenses were efficient. What really contributed to the total of 60 points was the pace in this game, with UCF running 85 plays and Tulsa running 72. However, neither offense was able to successfully move the chains on drives. Tulsa only posted a 41% success rate, and UCF was abysmal at 32%. On passing downs, Tulsa's success rate dropped all the way down to 24% and UCF's dropped to 28%. Neither team completed more than 60% of its passes, and neither team averaged more than four yards per carry. Both teams ran a lot of plays, but neither one was able to move the ball efficiently.
Success rate was an area I was going to monitor this year for UCF. Last year the offense was able to generate a lot of points based off explosiveness, but what might surprise some people is that the Knights only ranked 49th in success rate in 2019. Performances like these can happen when an offense is too reliant on explosive plays.
Confounding Conclusions
This section features games with a lopsided box score that, for whatever reason, did not translate to the final score.
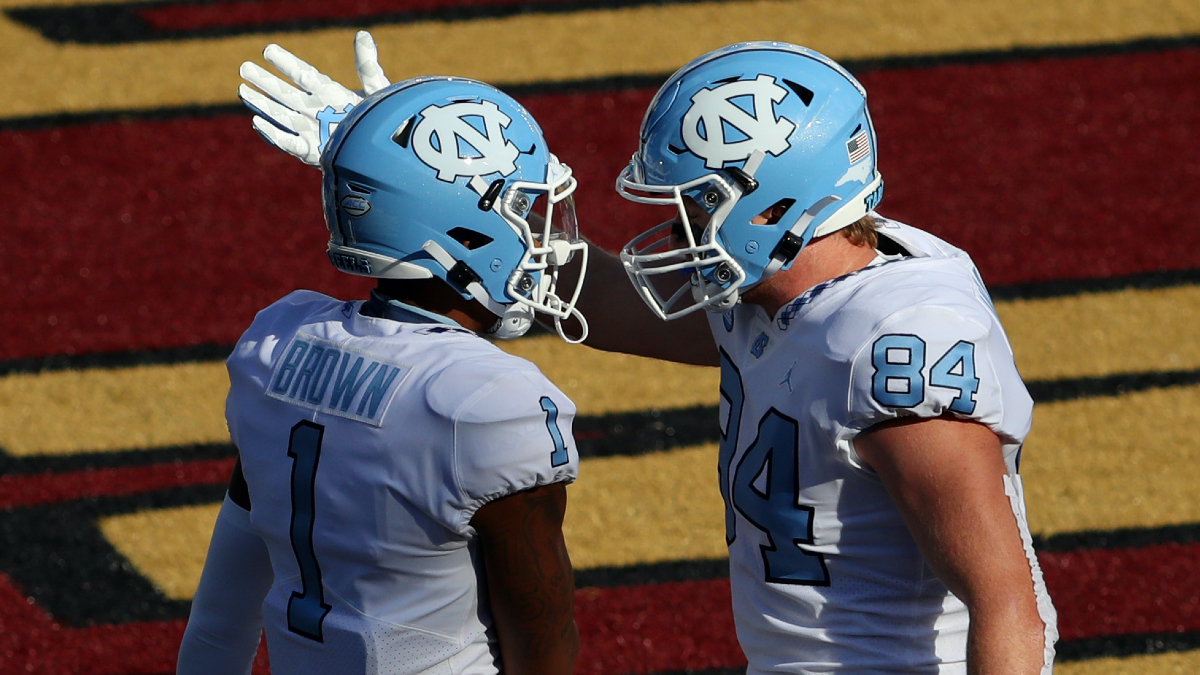
North Carolina 26, Boston College 22
Boston College had a chance to tie this game late after scoring a touchdown to make it 24-22 in favor of North Carolina. However, quarterback Phil Jurkovec threw a "pick-two" on the two-point conversion to give North Carolina a 26-22 victory.
However, the box score indicates that the Tar Heels' victory probably should have been a bit more comfortable. North Carolina had a 47% to 41% advantage in terms of success rate, and a yards per play advantage of 6.2 compared to Boston College's 4.7. Its defense held Boston College to only 5.6 yards per pass attempt and 2.1 yards per carry.
Ole Miss 42, Kentucky 41
Kentucky has been hosed two weeks in a row now. Despite holding a massive advantage in success rate and yards per play, the Wildcats lost this one in overtime due to their kicker missing an extra point.
Kentucky's offense posted an incredible 64% success rate and 7.6 yards per play. On the other side, the Ole Miss offense had a 52% success rate and 6.9 yards per play. Kentucky was able to get whatever it wanted on the ground, posting a 68% success rate on rushing plays and compiling 408 yards on 56 carries. Kentucky was unable to generate any turnovers, however, and coughed up the ball once. The Wildcats also lost the penalty battle, picking up 81 yards compared to 33 for the Rebels. Kentucky was the better team, but a few small mistakes allowed the game to go to overtime, and Ole Miss ended up leaving with a win.
NC State 30, Pittsburgh 29
Honestly, I'm having a hard time finding an important metric where Pitt wasn't more efficient than the Wolfpack. In yards per play, Pitt held the advantage at 6.4 to NC State's 5.2. Success rate? Pitt held a 41% to 39% advantage, and on passing downs, the Panthers posted a 40% success rate compared to NC State's 31% success rate. Pitt even had a better average starting field position, and averaged more points than NC State after driving the ball past the 40-yard line.
Where things went wrong was in the red zone, even though Pitt was more efficient inside the 40-yard line. NC State generated touchdowns on both of its red-zone trips, while Pitt only put up touchdowns on two of five red-zone opportunities. Pitt also racked up 45 more penalty yards than NC State. It was just a few key mistakes that caused the Panthers to lose this game despite being the more efficient team.
>> Sign up for The Action Network's daily newsletter to get the smartest NFL conversation delivered into your inbox each morning.


