All of Collin's projected totals and edges against the betting market are available in our college football model projections, part of Action PRO.
The Action Network podcast presents the voicemails of the disgruntled who have lost wagers. More specifically, there has been an increase in the number of under tickets lost because of fourth-quarter shenanigans. With a new team and/or conference rolling into each slate, it's important to check if there's an increase in the amount of totals that go over the number.
Looking back to Week 6, the Big Ten, Pac-12 and Mountain West had yet to start play, while the SEC, Big 12 and ACC were all learning to play during a pandemic. While most conferences such as the SEC and Big Ten have produced an even number of wins for the over and under, there's a different story to be told in the ACC, AAC and MAC.
Since Week 6, Independent teams, along with the ACC, AAC and MAC, have produced a total over the closing number in 64% of games. Outside of those conferences, Boise State, Kansas, North Texas and Florida have produced an over ticket in 19-of-21 games.
The Week 10 Pace Report continued to track totals that steamed more than two points lower in the closing number versus the opener. That trend continued through Week 11, as over bettors are winning at a 62% clip since the beginning of SEC play on Sept. 26.
There could be a number of reasons for the increase in points during 2020, from COVID-19 disruption to new coaches, schemes and transfers. This Pace Report utilizes a number of variables to come up with a projection for each game (all of which are included in Action PRO).
Oddsmakers in New Jersey and Las Vegas have an assigned point value for each team, and that number is adjusted based on ensuing game results. I go a bit further by applying some math and advanced stats to my projections.
The formula first takes into account yards per play for offense and defense. Plays per game are also integrated into the yards per play difference to come up with a total. The formula is incomplete without a sign of what teams do in scoring opportunities. Finishing drives and pace must be accounted for in totals.
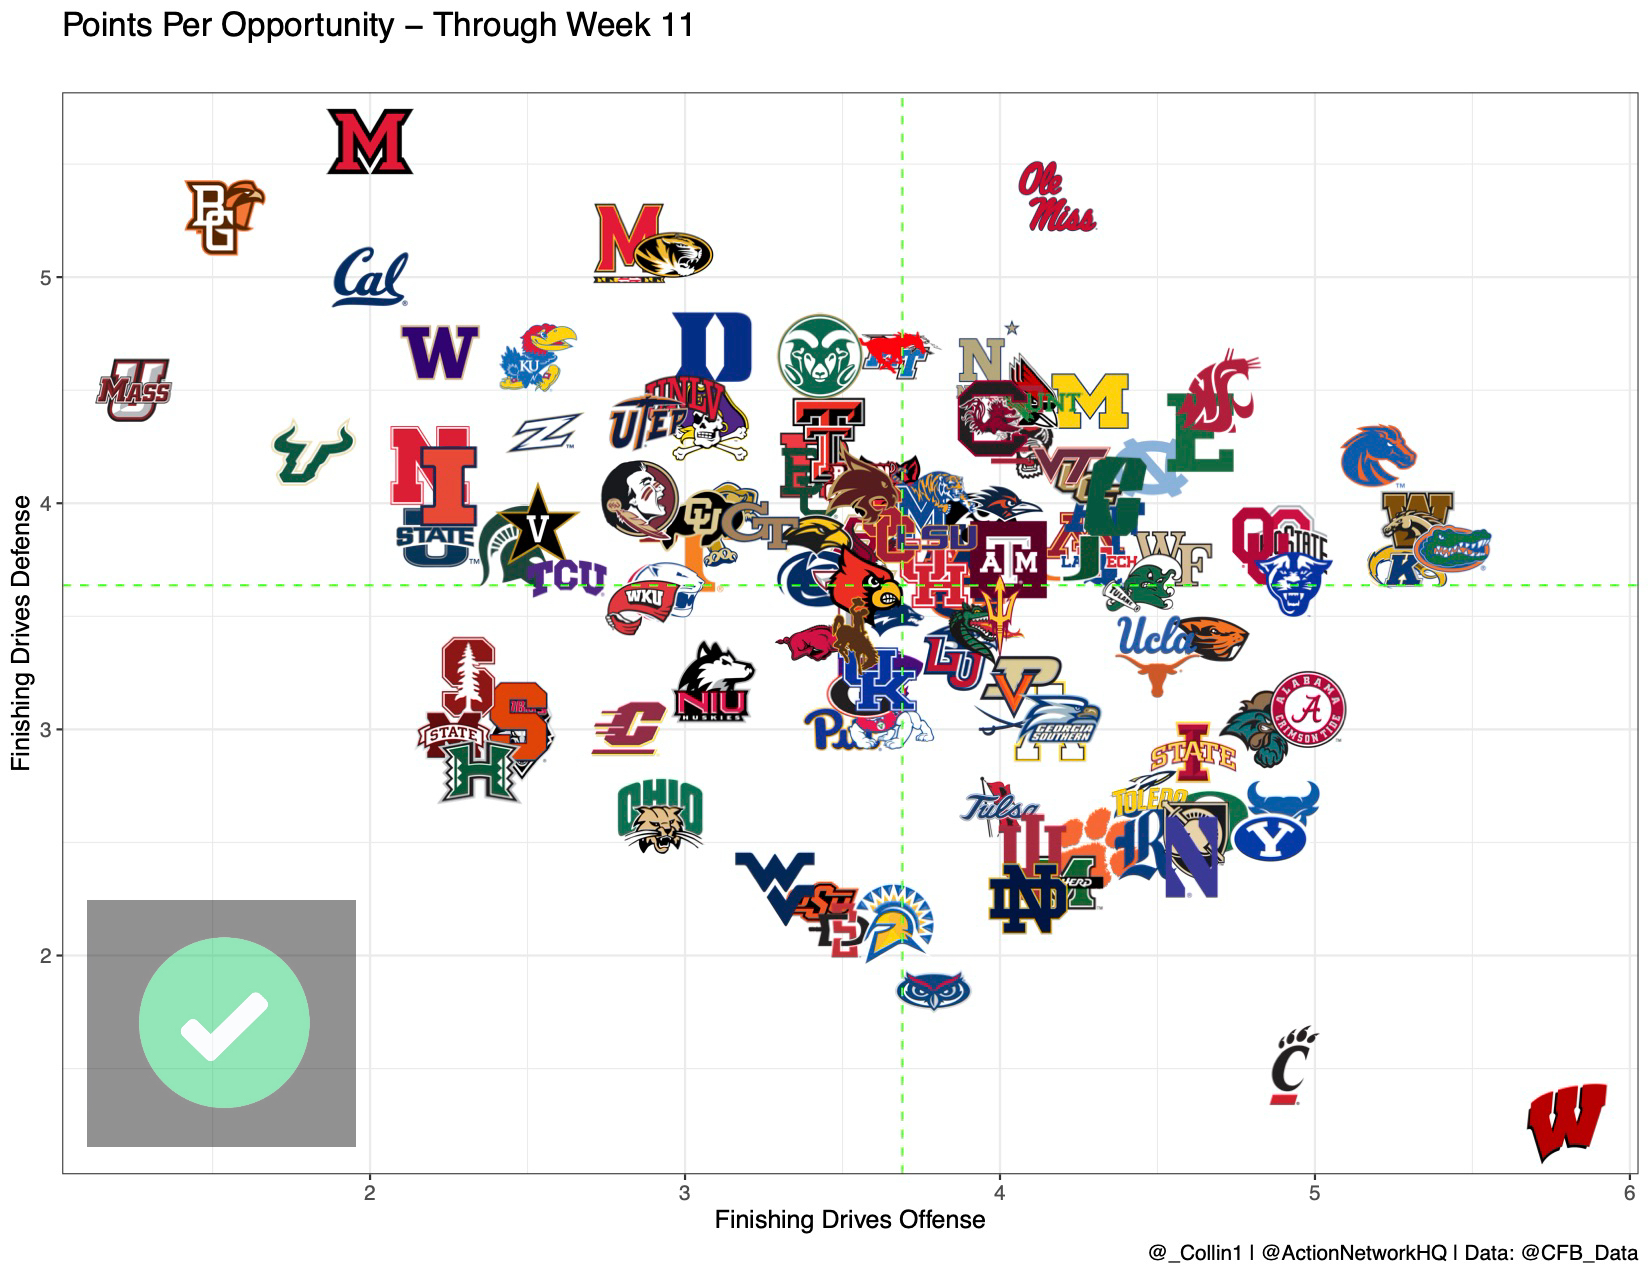
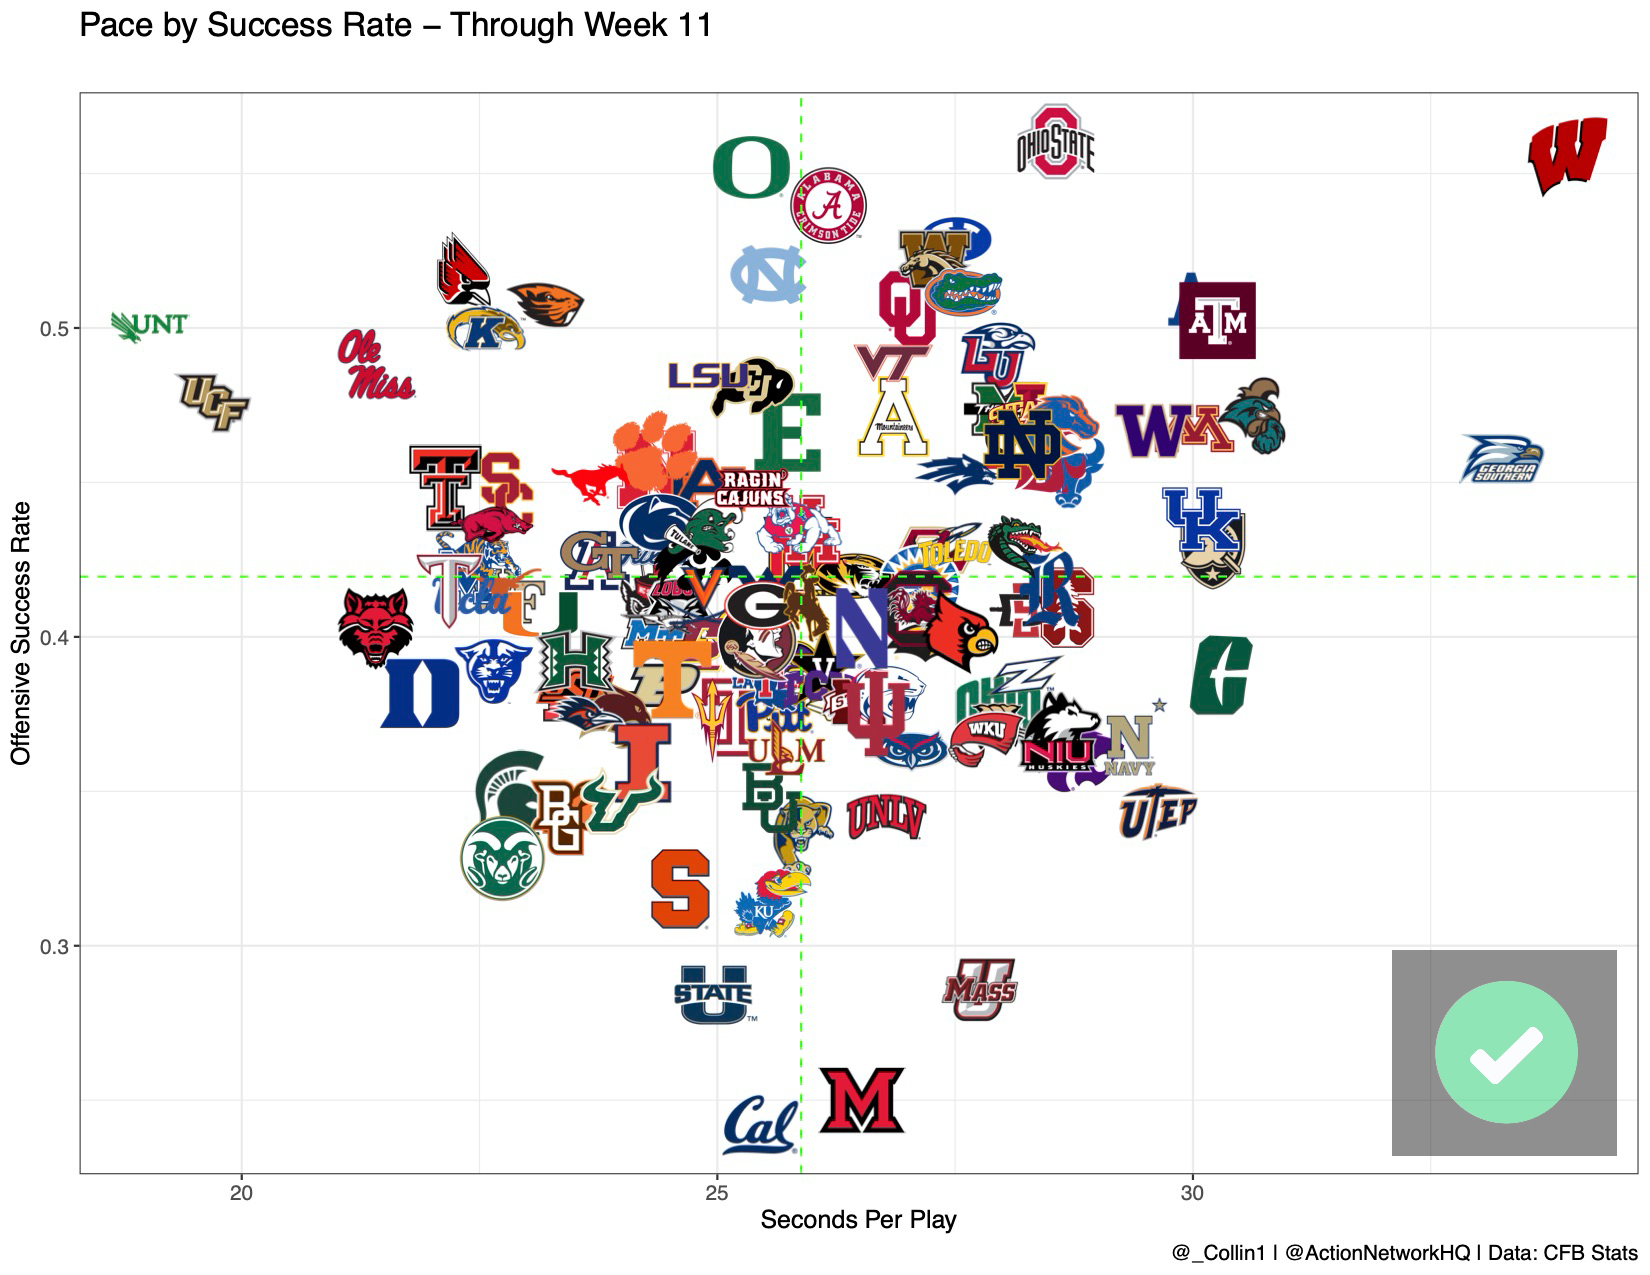
Whether or not a team is fantastic within the 40-yard line for scoring opportunities, pace of play must be considered. Seconds per play can give investors an inside track into which teams have more snaps per game, and — in combination with Success Rate and Finishing Drives — it can develop facts around scoring points.
Our Pace by Success Rate chart looks at Seconds Per Play along with Success Rate (defined as gaining 50% of needed yards on first down, 70% of needed yards on second down or 100% of needed yards on third or fourth down).
Week 12 Projected Totals
Our model projections, now part of Action PRO, automatically compare our projected totals to the betting market and grade them on an A-F scale.
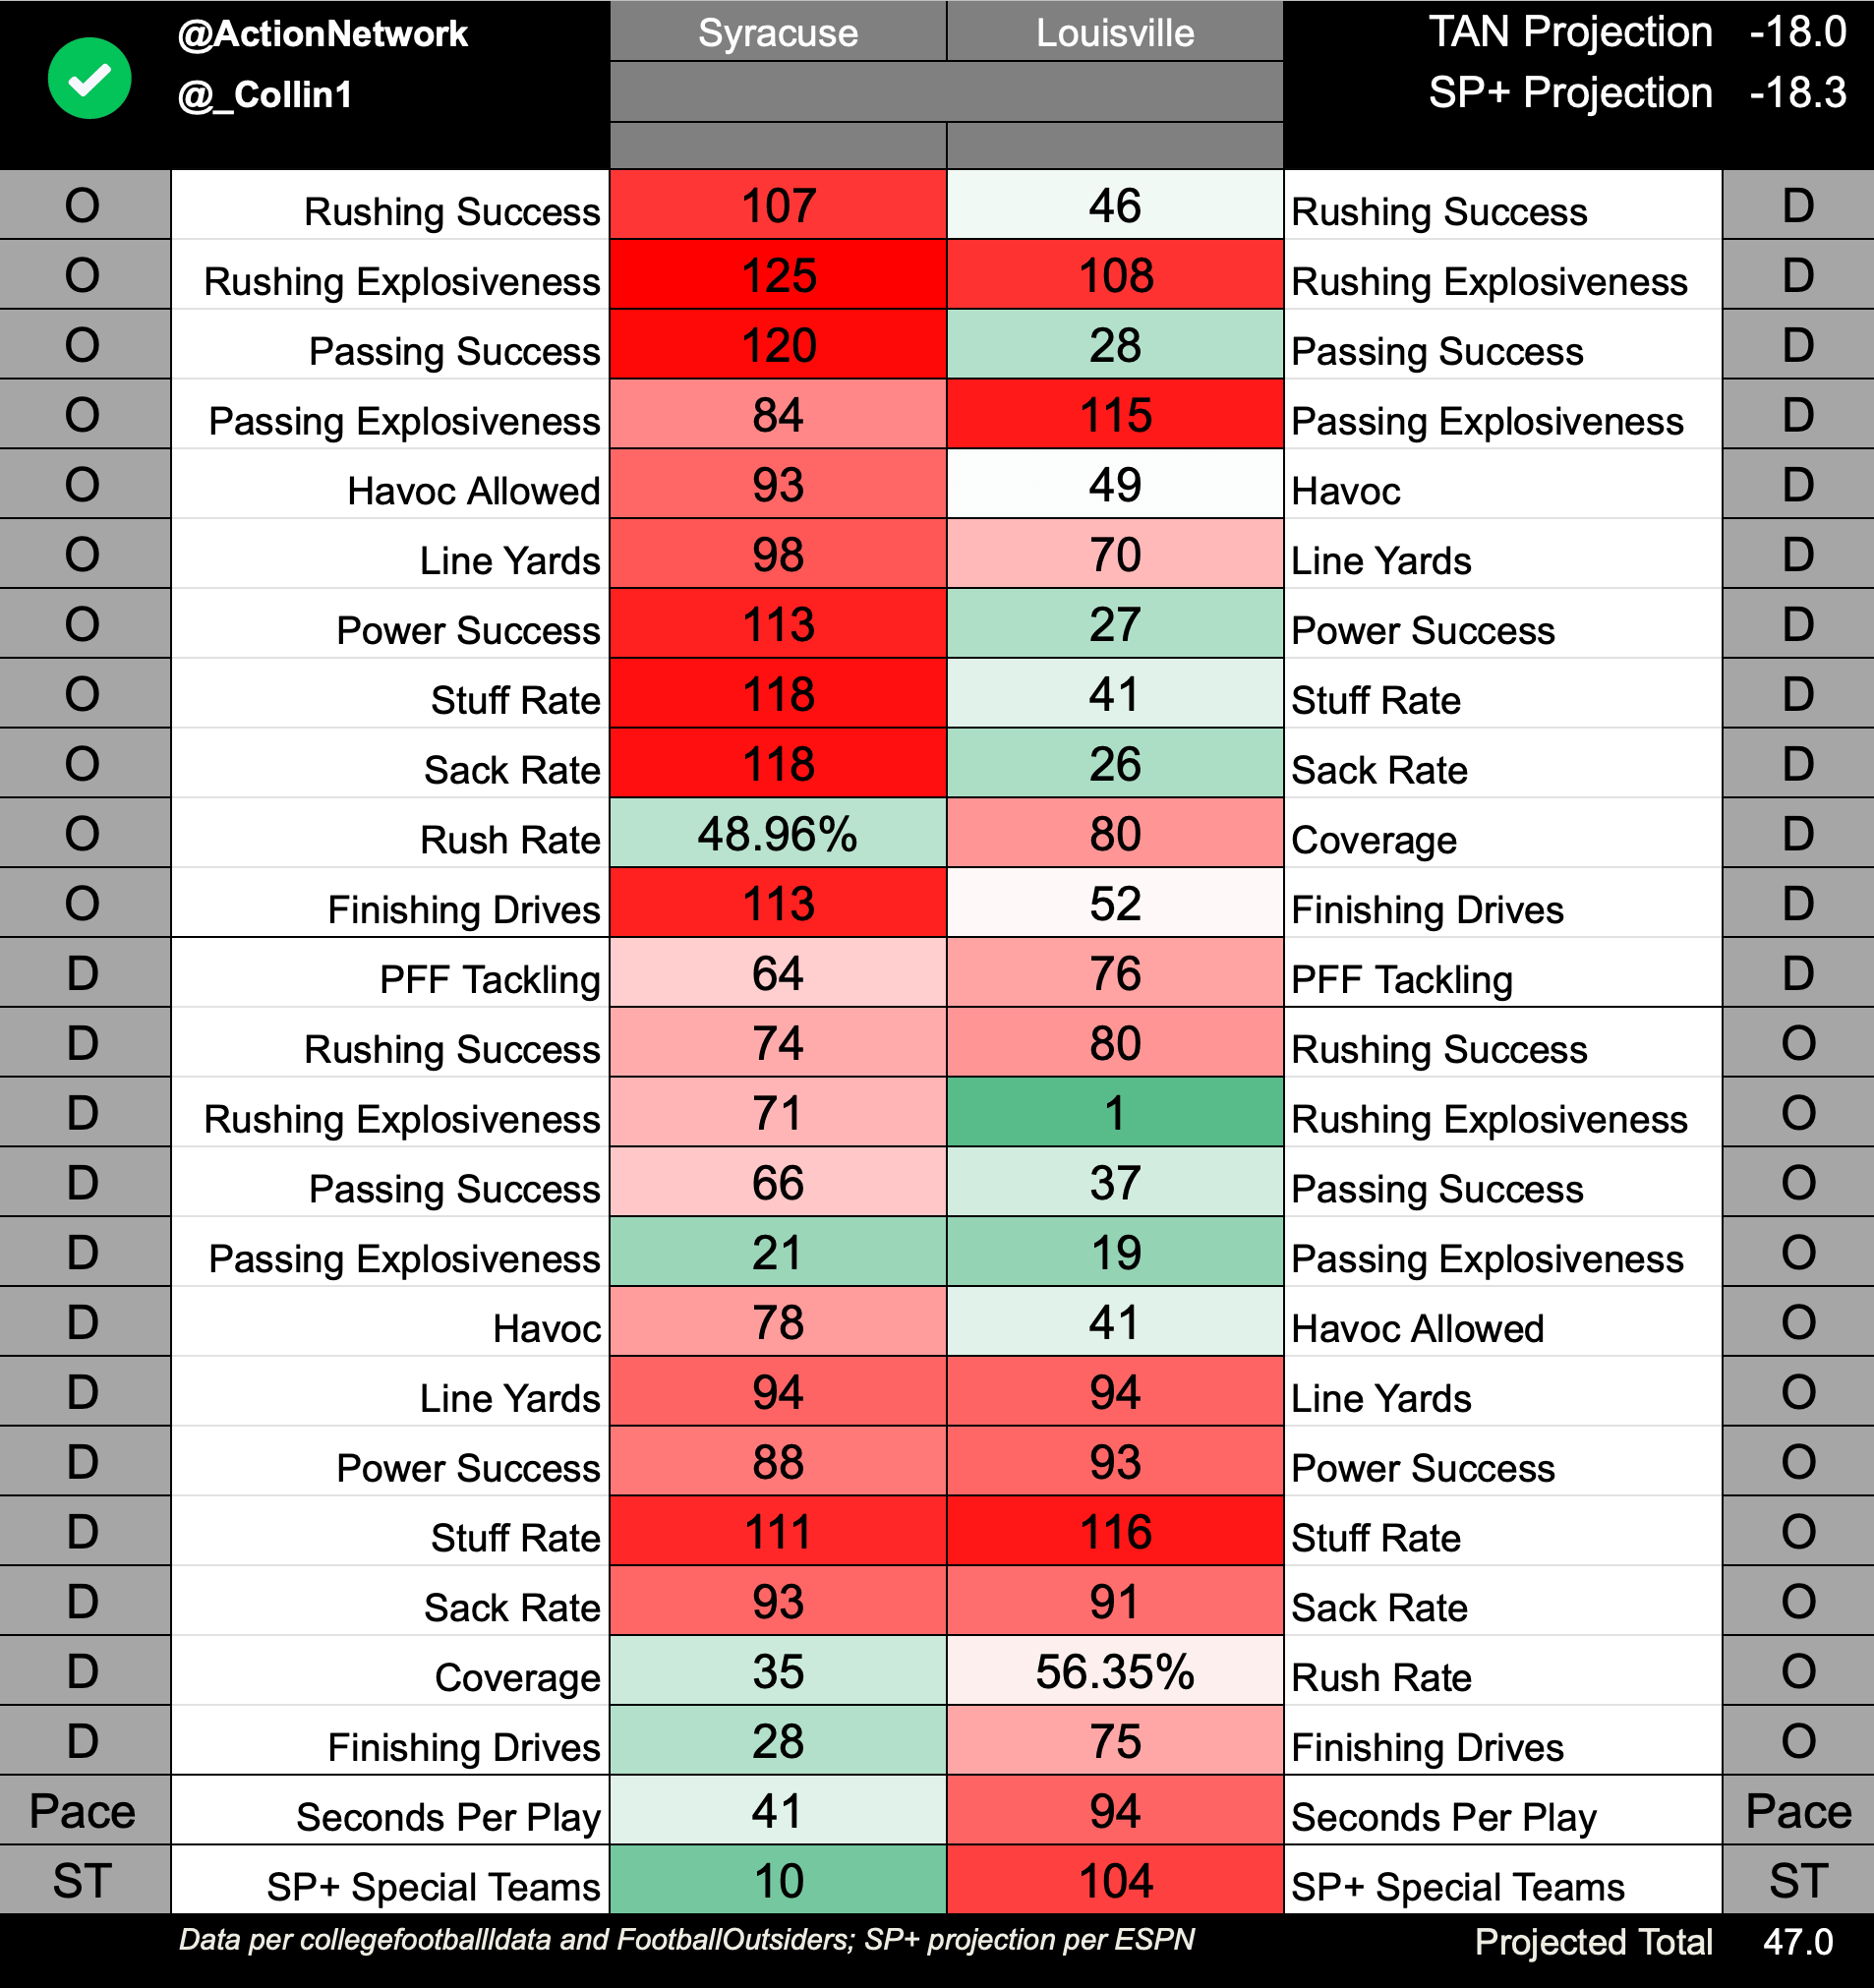
Syracuse vs. Louisville
This season has not been one to remember for Dino Babers with Syracuse now at 1-7 on the season. As the Offensive Success Rate continues to diminish so does the number of points put up by the Orange. Most categories that matter to a total are all ranked outside the top 100, including Offensive Finishing Drives and Passing Success Rate.
The downward spiral is also in effect for Louisville, which has won just a single game in its past seven played. The Cardinals have gone over the total at home in all four games led by a top-20 explosiveness rank. The Orange defense ranks 21st in opponent pass expected points, which may limit red-zone trips for Louisville. If Louisville is going to control tempo, a rank of 94th in seconds per play will get the under ticket to the window.
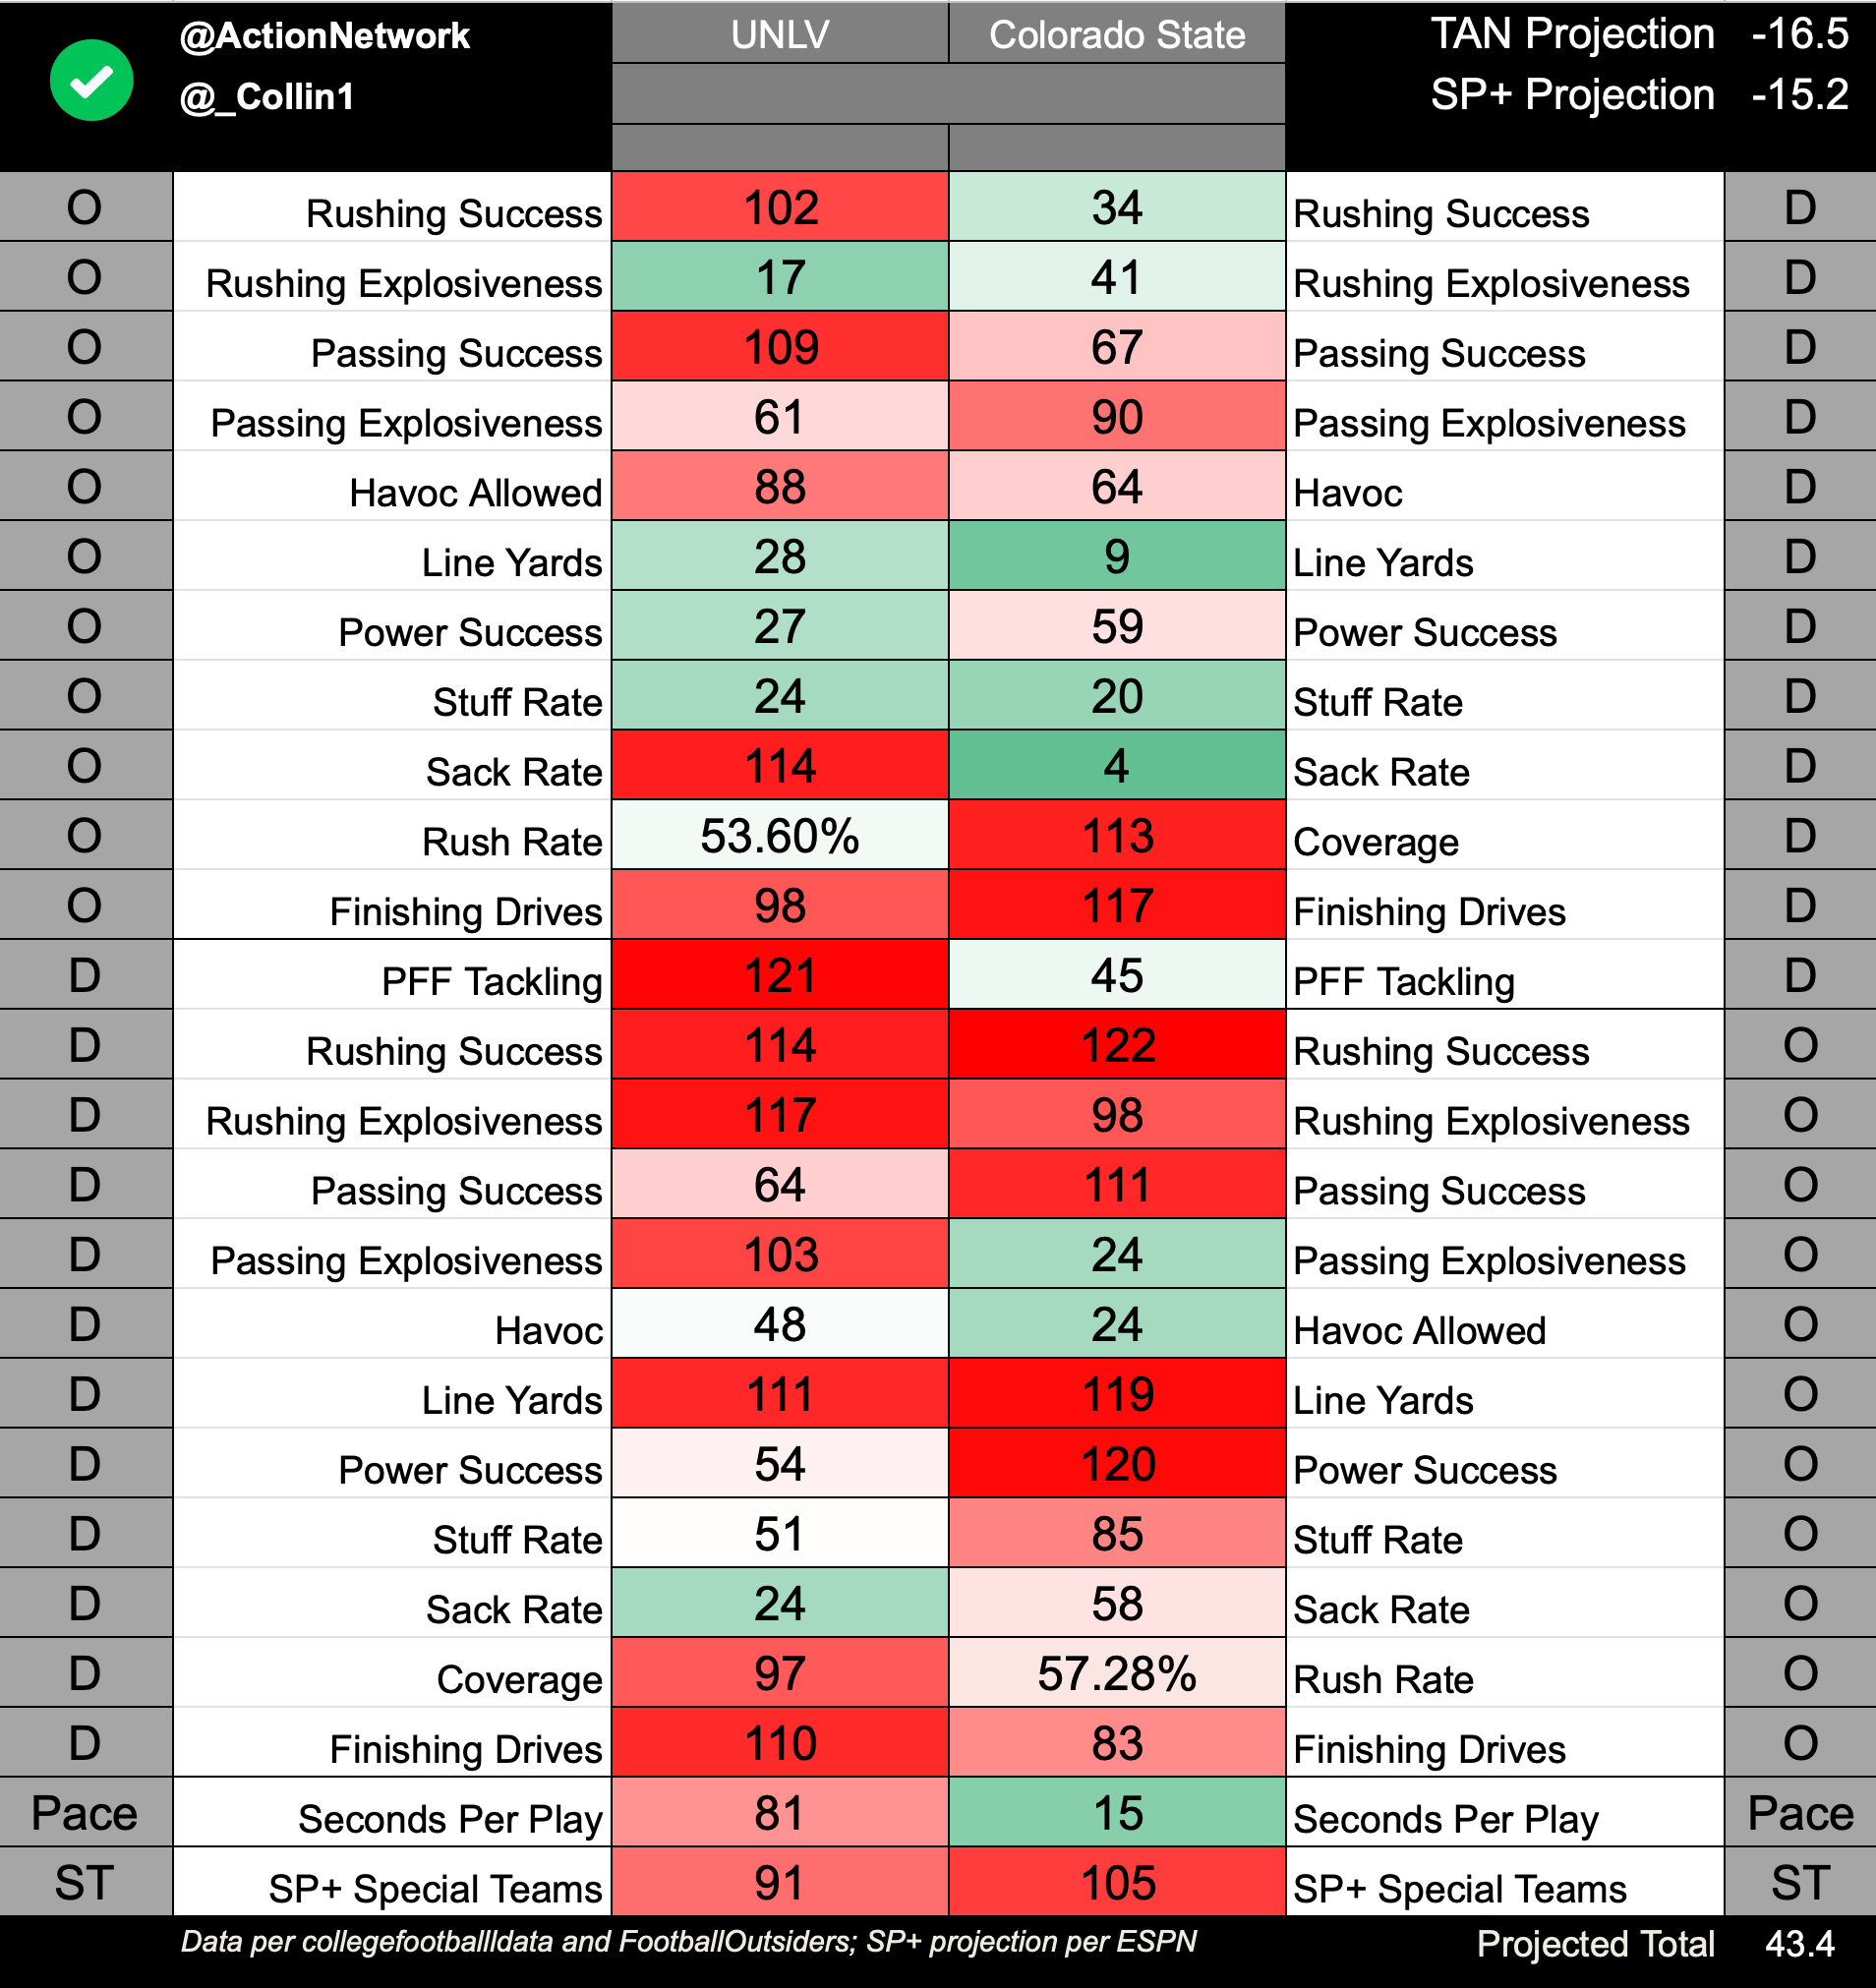
UNLV vs. Colorado State
With an elevation of 5003 feet, Fort Collins is the site of Colorado State's home games. Any team not accustomed to playing in altitude can have problems in the scoring department.
UNLV ranks outside of the top 100 in Offensive Success Rate with a Finishing Drives rank of 98th. The most obvious advantage in this game is Colorado State's Adjusted Sack Rate against the Rebels' offensive line.
The Rams' Offensive Success Rate is one of the lowest in the country in combination with Line Yards and Power Success. Head coach Steve Addazio favors a rushing attack, but the Rams have had little success controlling the trench. Expect passes to come in only long-yardage situations in which the explosiveness could occur, but not enough to go over the total.
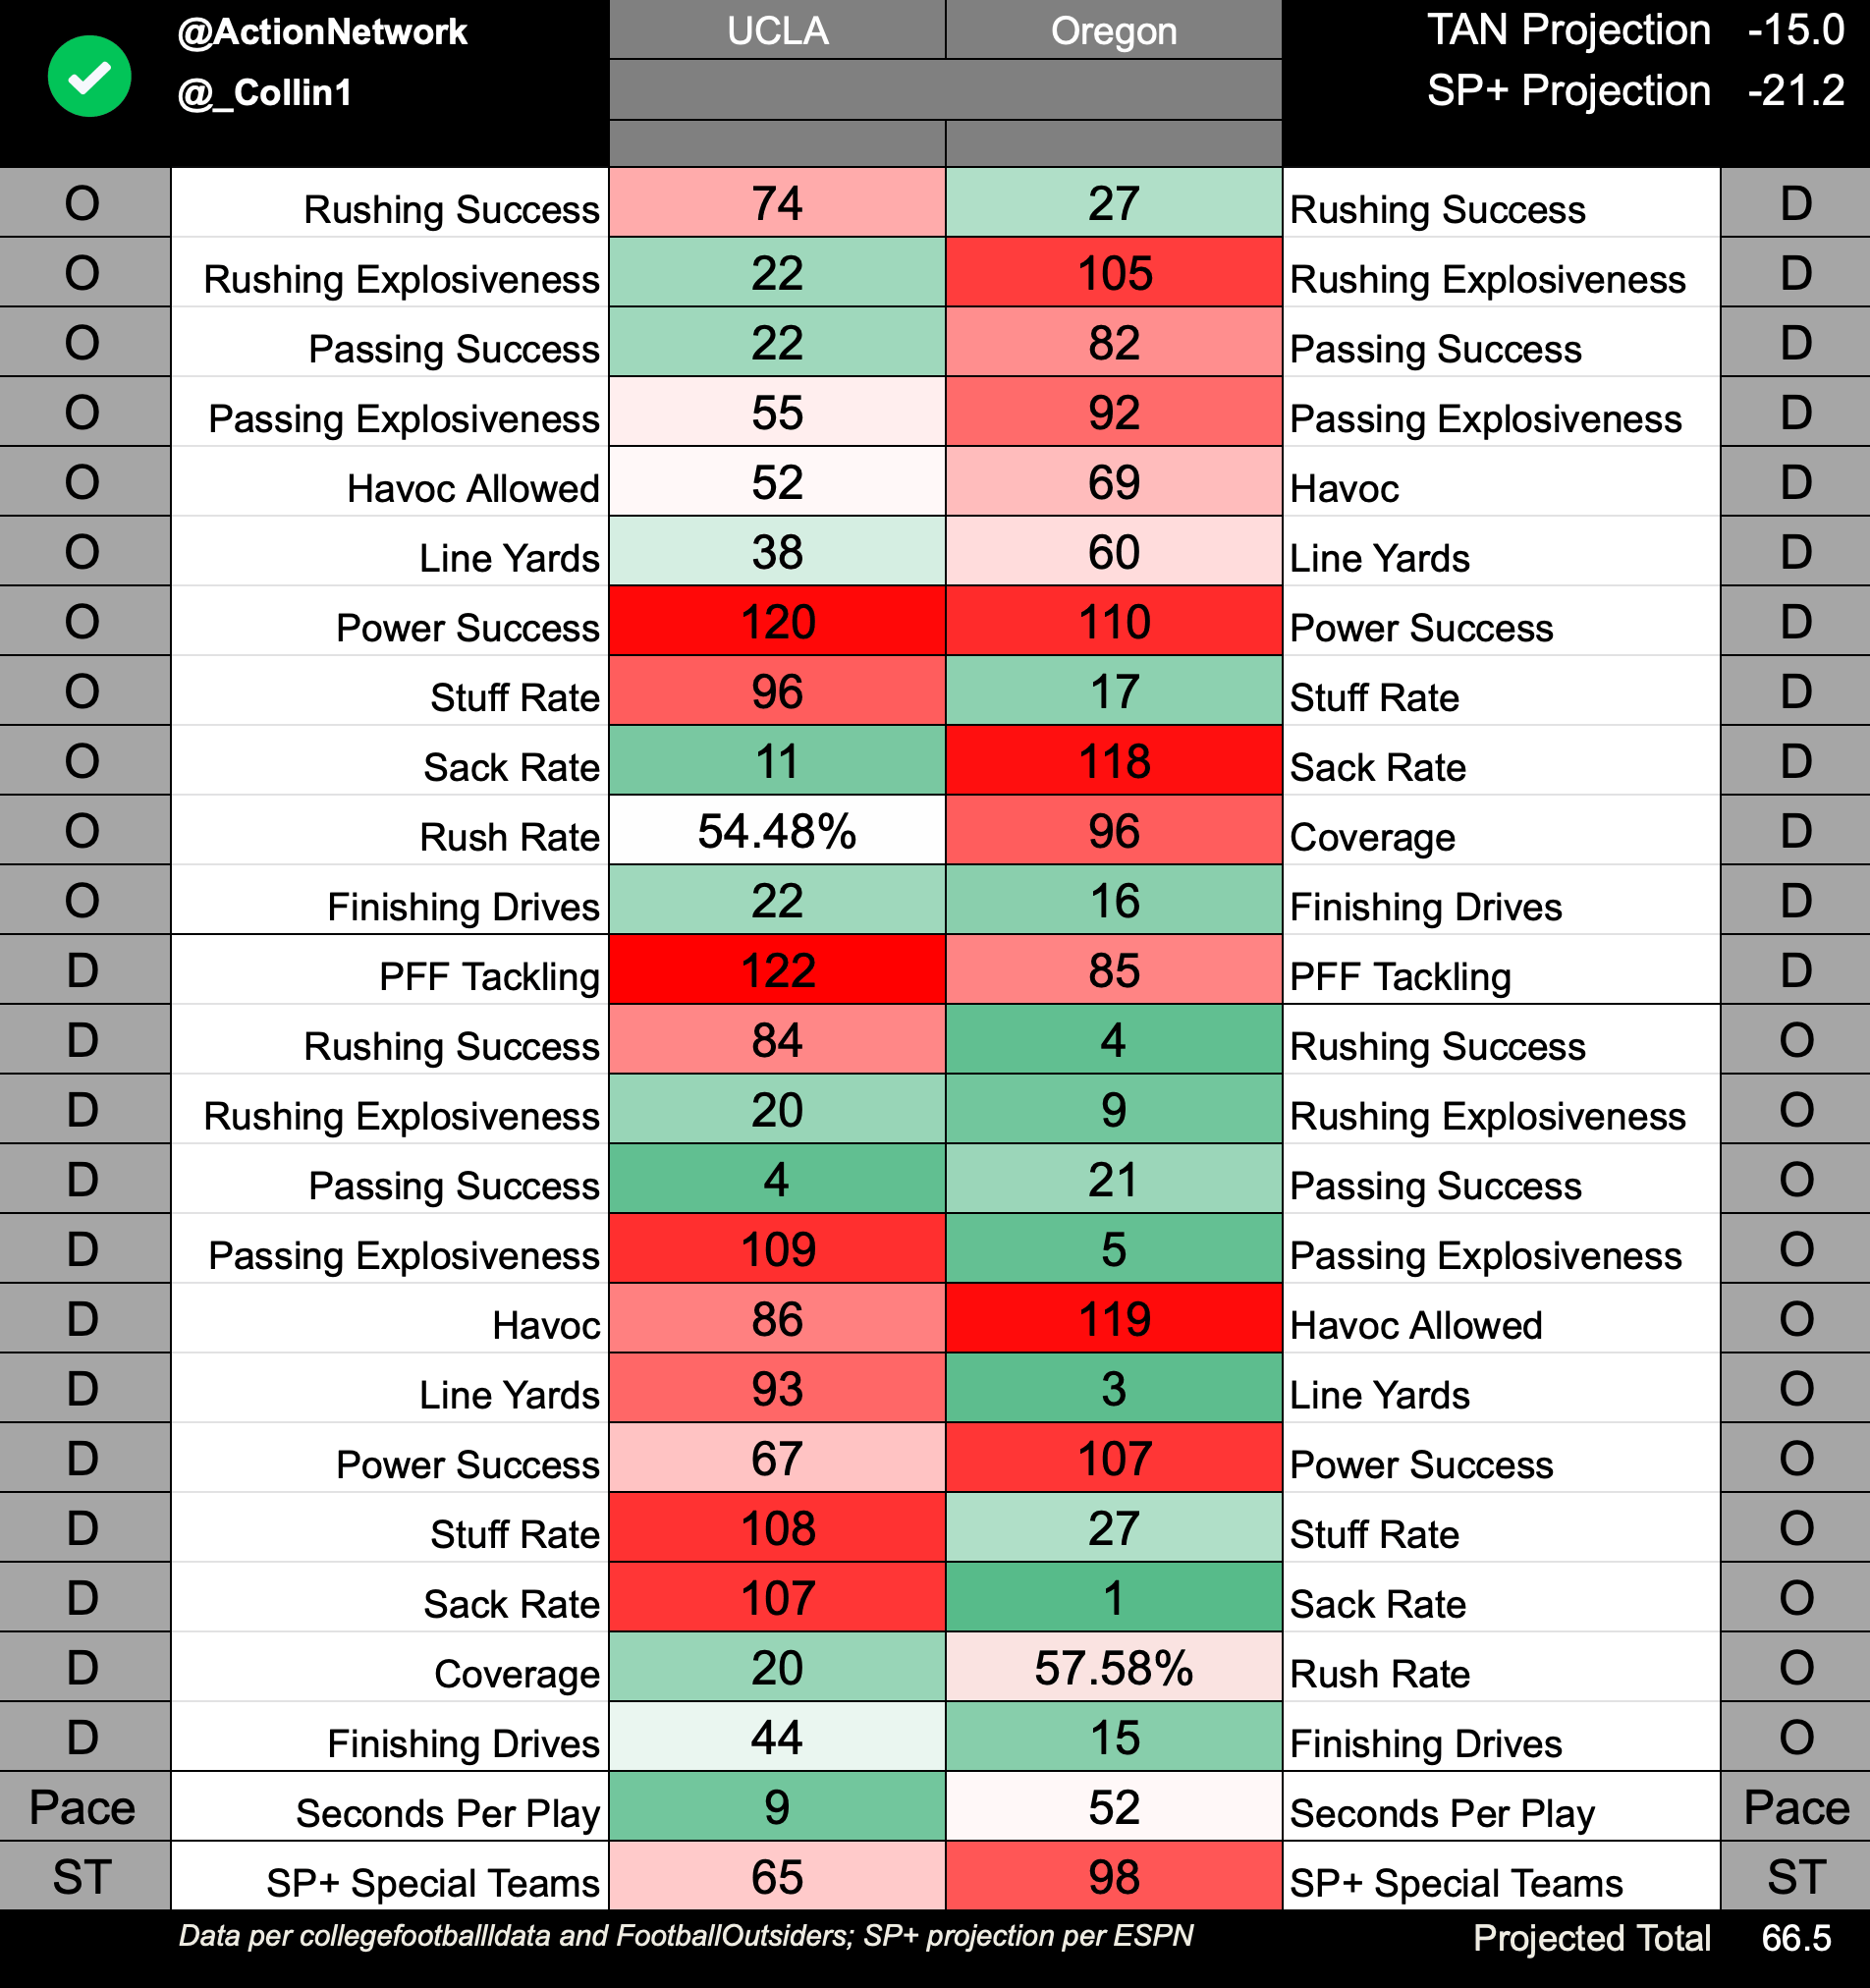
UCLA vs. Oregon
Oregon and Washington State had 15 combined trips through the opponent 40-yard line and could not put up enough points to go over the total. When the Ducks host the Bruins, there may not be an issue with points, as both teams rank in the top 22 in Offensive Finishing Drives.
UCLA plays at a frenetic pace, ranking ninth in seconds per play, updated after Sunday's victory over Cal. The biggest reason for an over in Week 12 comes via the explosive play. Oregon owns a top-10 ranking in offensive explosiveness, collecting six runs of at least 20 yards and seven passes of 15 yards. UCLA boasts a bit of explosiveness of its own, holding a rank of 22nd in rush explosiveness. More importantly, both of these teams have respective ranks outside the top 100 in Opponent Expected Points, coverage and Sack Rate.
