This is part one of a series that aims to re-think how we look at the NHL Draft. In this series, we will try to identify biases and NHL draft market inefficiencies, but first we need to establish expected value for a given draft pick.
Like in many other sports, hockey analysts have spent a lot of time quantifying the expected value of draft picks. They tend to be charted like this, using estimates by Michael Shuckers:
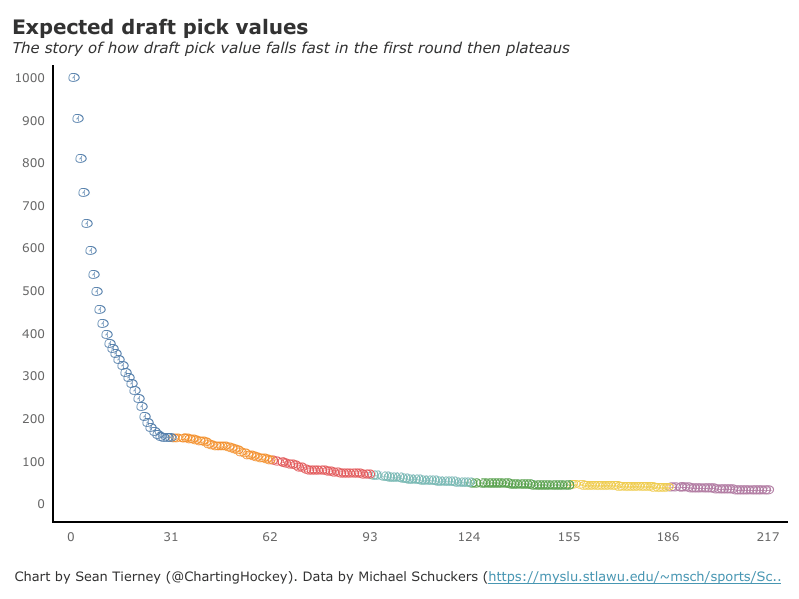
While the general trend of the above draft-pick value chart has been widely accepted among the hockey analytics community for years, I believe previous research into pick values has a large blind-spot: It grossly undervalues the top picks in a draft.
Today we will revisit draft pick value charts in an attempt to correct this error.
Defining Draft Pick Value
Defining NHL draft pick value is actually relatively easy. All you need is something to value players, then take a few drafts and plot all the player's cumulative values against their draft picks. The line of best fit can then be interpreted as a draft pick value curve.
For our measure of player value, we will use Evolving Hockey's Goals Above Replacement (GAR) instead of games played, which is what other models, like Shuckers', used.
Games played is a good starting point, but GAR is superior because, within a game, good players produce more GAR than bad ones. As a result, this is the first step toward better pick value charts because it can identify the difference between a third-pairing defenseman and an elite rearguard, like Victor Hedman, even if they both play the same amount of games.
Next, we will need a sample size to look at. This analysis is going to use a player's total value in the first seven seasons after the draft. Why seven seasons? This number is not an exact science, but it's a good measuring stick because after seven seasons the No. 1 overall pick from that draft can become Unrestricted Free Agents (for example, the first overall pick from 2009 could become a UFA for the first time in 2016).
As a result, we will be restricted to the 2007-2014 drafts because those are the only ones with enough data since draft day. Now, all we have to do is plot all the players drafted over that span's cumulative Goals Above Replacement against their draft slot.
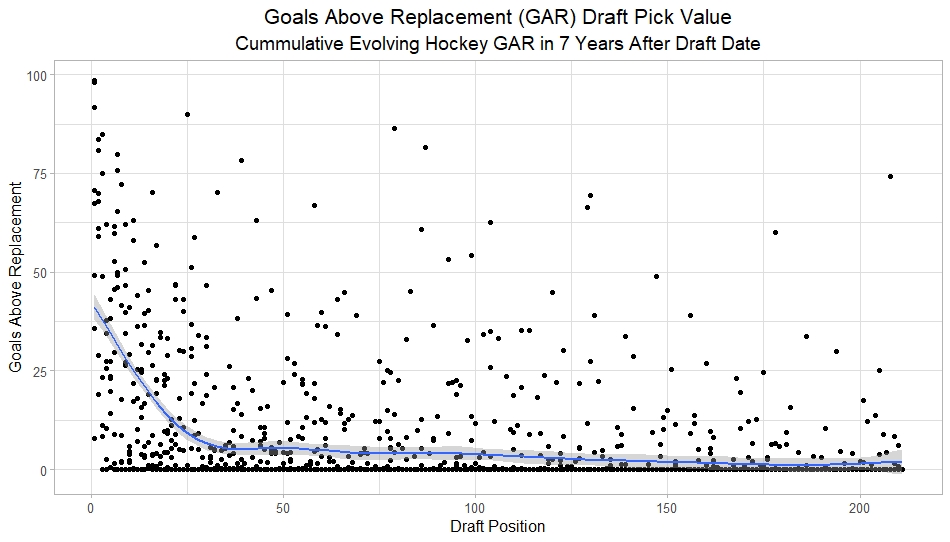
Next, we just fit something like the trendline on the graph above and boom! We have our draft pick value estimates. Note that a Generalized Addadtive Model (GAM) is going to be used here because we need something really flexible to represent this data.
Here is the following result:
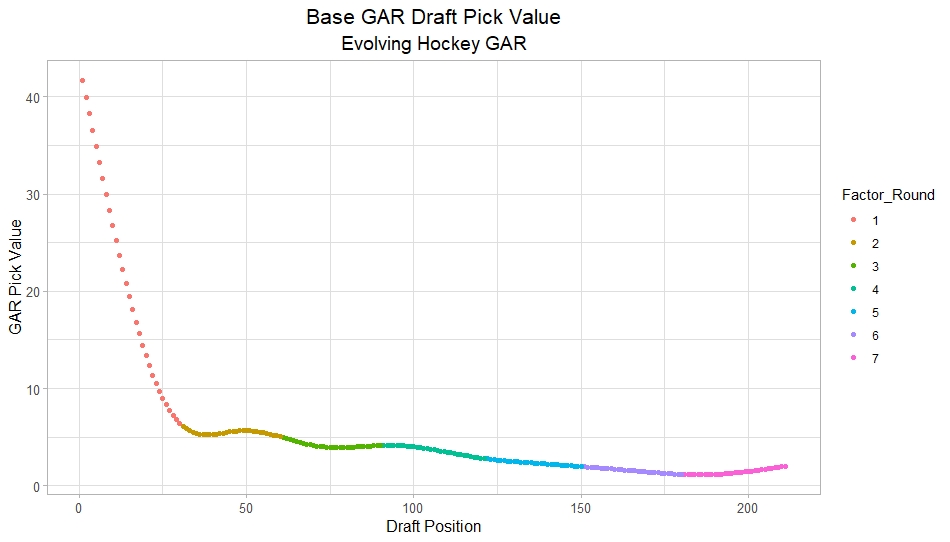
But this pick value chart falls into a similar trap as previous iterations. The No. 1 overall selection is obviously the most valuable, but not by a wide margin. It suggests first overall picks are incredibly close in value to the next few picks.
Improving Pick Value Charts
So even though I used a new metric, it found similar results to previous research. What's the problem? Well, let's look specifically at the top two picks. Notice above the most valuable picks were estimated to be worth about 40 GAR. Based on previous No. 1 overall picks, this is incredibly low.
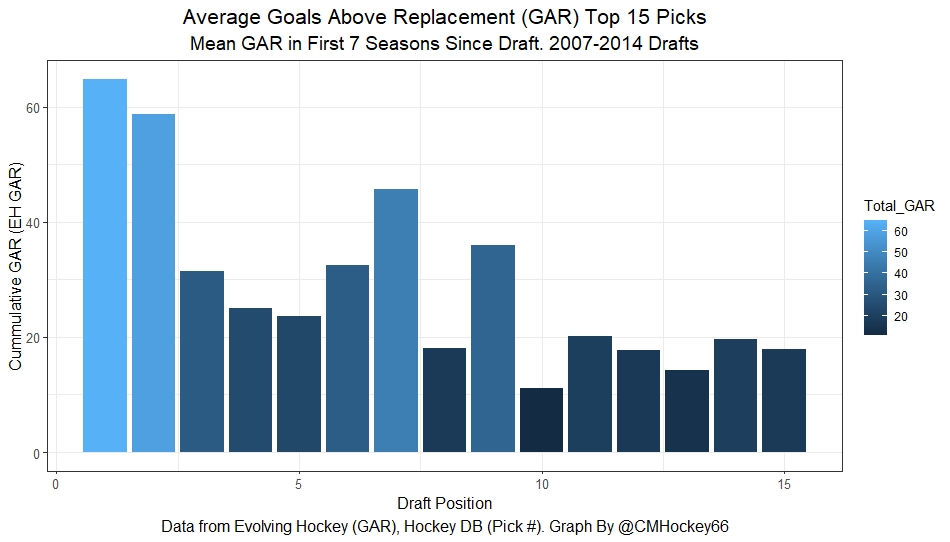
No. 1 overall picks have been worth about 60 GAR, on average and No. 2 overall picks were not that far behind. This is about 50% more output than our first draft pick value model estimates for the first two picks in the draft.
Why the discrepancy? The model being used was not flexible enough to account for the extreme non-linearity at picks one and two. It was systemically overvaluing picks just outside the top two to try and reach the extremely high value of the top two picks.
To combat this, we are going to add dummy variables for the first and second overall picks and re-run the model. Dummy variables for picks No. 1 and No. 2 will allow the model to sort of "break." They allow for the model to have first and second picks as much more valuable than anything else if the data suggests it's called for.
Note that the extreme uncertainty in the NHL Draft seems to begin with the No. 3 overall pick. As a result, the dummy variables stopped after the second pick. With the dummy variables, the pick value model looks much more realistic.
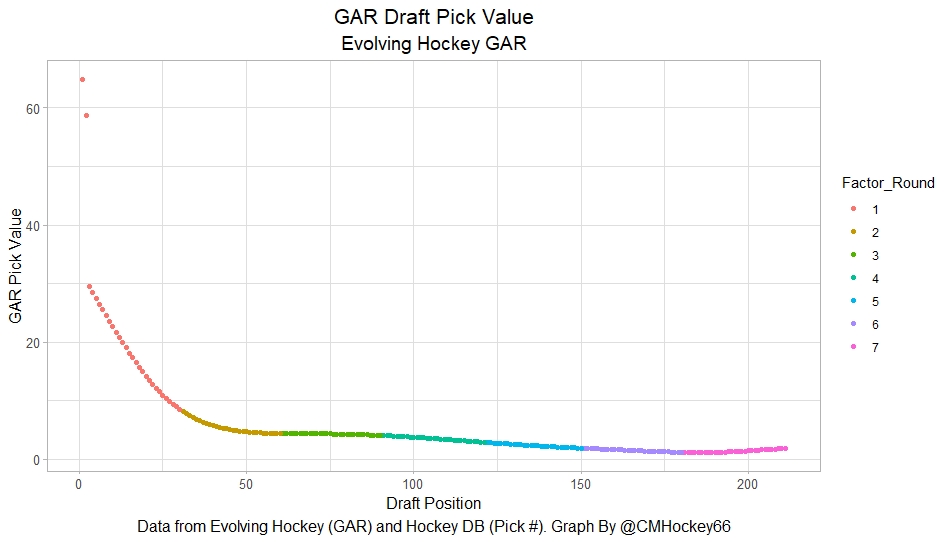
The draft pick value chart proposed above does a much better job of accounting for how truly valuable those top draft slots are.
Here is a comparison of my new proposed pick value model plotted against the previous one by Shuckers. Note both models have had their values normalized such that the first overall pick is worth 100 since they have different scales (GP vs. GAR).
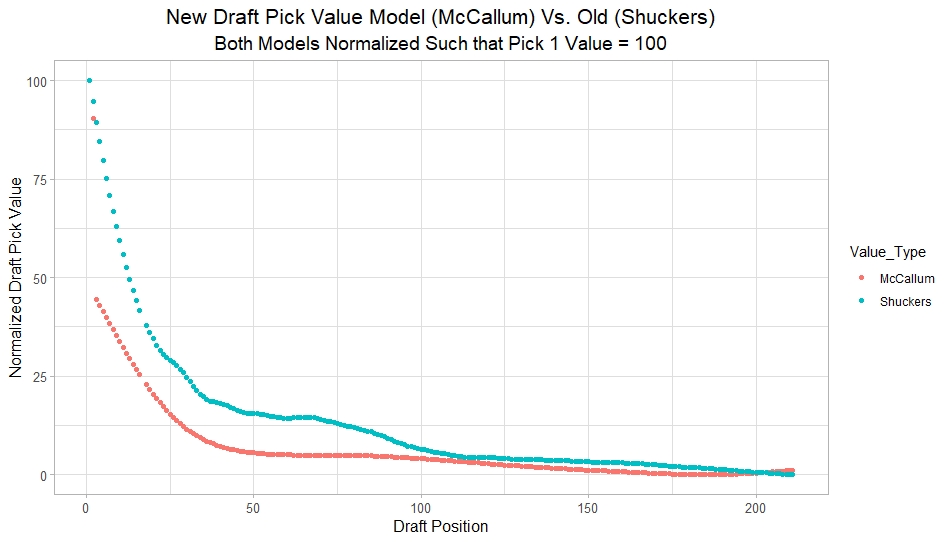
The Shuckers Model implied that the No. 3 overall pick plus a second-rounder are worth more than the average first overall pick! My new method suggests the top pick in the draft is worth slightly more than two third overall picks! My new method seems much more realistic.
The side-by-side comparison shows that, relative to the No. 1 overall pick, the old pick value chart was, essentially, overvaluing the entire draft. The Shuckers Model was especially overvaluing picks 3 through 10.
External Validity
There is one area that might concern some people. I looked at a relatively small sample. I was only able to use eight drafts worth of data. So were my findings a result of a strange sample? Well, looking at the data, I doubt it. In fact, I think my results may still undervalue the No. 1 overall pick.
How can this be possible? Well, 2007-2014 saw many great players drafted. But, it just misses probably the five most impactful draft picks of the past 20 years. And all five of those picks were selected first or second overall.
If my sample happened to extend three more years back to 2004, it would include Alex Ovechkin (No. 1 overall, 2004), Evgeni Malkin (No. 2 overall, 2004) and Sidney Crosby (No. 1 overall, 2005). On the flip side, if the sample went two years longer, it would include Connor McDavid (No. 1 overall, 2015) and Auston Matthews (No. 1 overall, 2016).
Crosby, Malkin, Ovechkin, McDavid and Matthews likely represent the three best players of the last generation plus the two best of this current generation. As a result, if this analysis had included these five players and their draft classes, it would only push the value of the top two picks further above the rest.
Not only that but one of the eight picks in my dataset was Nail Yakupov (No. 1 overall, 2012), a once-in-a-generation bust. Yakupov represents a large part of my sample, but in spite of that, we still found the first and second overall picks to be dramatically undervalued.
Given that my model's sample just misses, five generational talents while including Yakupov, it seems possible to me my model still undervalues the top two picks in an NHL Draft.
Wrapping up
I propose a new NHL draft pick value chart that looks like this.

My new pick value model suggests the first and second overall picks are much, much more valuable than previous pick-value plots implied. I believe this is a step in the right direction for draft pick value analysis.
Further research may refine this finding, but the general direction of my model should stand the test of time.


